17539 Corinthian Dr Encino, CA 91316
Estimated Value: $3,488,448 - $4,502,000
4
Beds
5
Baths
4,988
Sq Ft
$792/Sq Ft
Est. Value
About This Home
This home is located at 17539 Corinthian Dr, Encino, CA 91316 and is currently estimated at $3,948,112, approximately $791 per square foot. 17539 Corinthian Dr is a home located in Los Angeles County with nearby schools including Gaspar De Portola Middle School, Encino Charter Elementary, and Birmingham Community Charter High.
Ownership History
Date
Name
Owned For
Owner Type
Purchase Details
Closed on
Oct 29, 2015
Sold by
Schmit Paul and Harutunian Armineh
Bought by
The Schmit Family Trust
Current Estimated Value
Purchase Details
Closed on
Sep 29, 2010
Sold by
Minc Rentals Llc
Bought by
Schmit Paul Jerome and Harutunian Armineh
Home Financials for this Owner
Home Financials are based on the most recent Mortgage that was taken out on this home.
Original Mortgage
$962,500
Outstanding Balance
$633,854
Interest Rate
4.31%
Mortgage Type
New Conventional
Estimated Equity
$3,314,258
Purchase Details
Closed on
Nov 16, 2001
Sold by
Seror David and The Bankruptcy Estate Of Johnn
Bought by
Minc Rentals Llc
Home Financials for this Owner
Home Financials are based on the most recent Mortgage that was taken out on this home.
Original Mortgage
$890,600
Interest Rate
7.37%
Create a Home Valuation Report for This Property
The Home Valuation Report is an in-depth analysis detailing your home's value as well as a comparison with similar homes in the area
Home Values in the Area
Average Home Value in this Area
Purchase History
| Date | Buyer | Sale Price | Title Company |
|---|---|---|---|
| The Schmit Family Trust | -- | None Available | |
| Schmit Paul Jerome | $1,375,000 | Old Republic Title Company | |
| Minc Rentals Llc | -- | -- |
Source: Public Records
Mortgage History
| Date | Status | Borrower | Loan Amount |
|---|---|---|---|
| Open | Schmit Paul Jerome | $962,500 | |
| Previous Owner | Minc Rentals Llc | $890,600 |
Source: Public Records
Tax History Compared to Growth
Tax History
| Year | Tax Paid | Tax Assessment Tax Assessment Total Assessment is a certain percentage of the fair market value that is determined by local assessors to be the total taxable value of land and additions on the property. | Land | Improvement |
|---|---|---|---|---|
| 2025 | $21,707 | $1,774,196 | $896,818 | $877,378 |
| 2024 | $21,707 | $1,739,409 | $879,234 | $860,175 |
| 2023 | $21,293 | $1,705,304 | $861,995 | $843,309 |
| 2022 | $20,335 | $1,671,868 | $845,094 | $826,774 |
| 2021 | $20,074 | $1,639,087 | $828,524 | $810,563 |
| 2019 | $19,481 | $1,590,472 | $803,950 | $786,522 |
| 2018 | $19,230 | $1,559,287 | $788,187 | $771,100 |
| 2016 | $18,223 | $1,488,108 | $757,582 | $730,526 |
| 2015 | $17,959 | $1,465,756 | $746,203 | $719,553 |
| 2014 | $18,019 | $1,437,044 | $731,586 | $705,458 |
Source: Public Records
Map
Nearby Homes
- 4718 White Oak Ave
- 4820 Encino Terrace
- 17115 Rancho St
- 4750 Encino Ave
- 4854 Encino Ave
- 4634 White Oak Ave
- 17401 Rancho St
- 4854 Alonzo Ave
- 4841 Alonzo Ave
- 17333 Rancho St
- 4565 Encino Ave
- 5305 5305 White Oak Unit F
- 4551 Alonzo Ave
- 4860 Enfield Ave
- 17962 Valley Vista Blvd
- 5004 Enfield Ave
- 18016 Valley Vista Blvd
- 5200 White Oak Ave Unit 30
- 5056 Louise Ave
- 17121 Rancho St
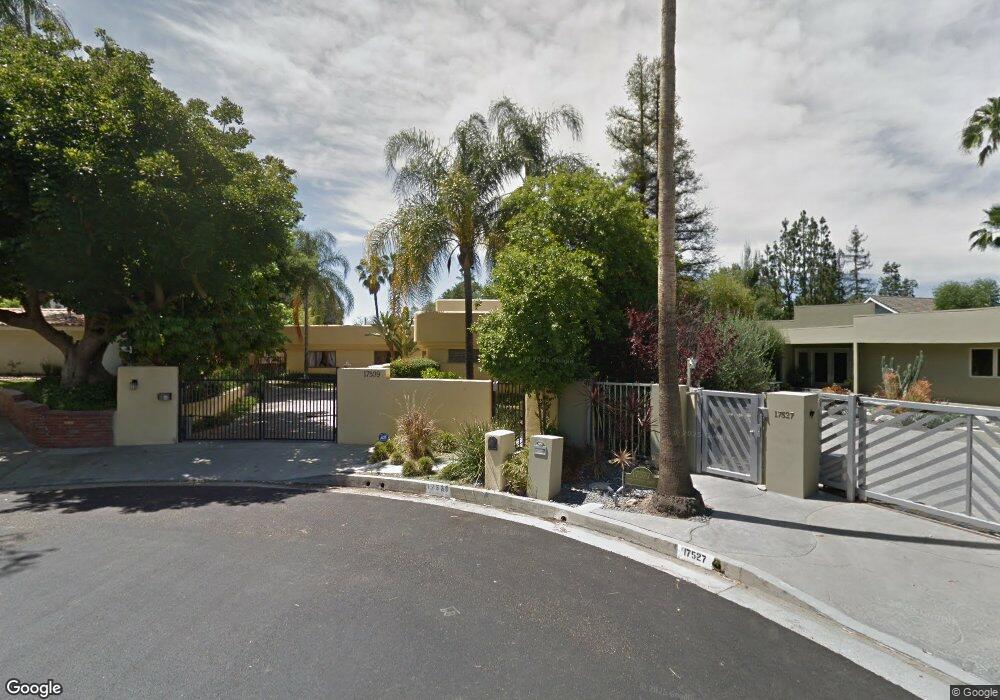
- 17527 Corinthian Dr
- 17534 Corinthian Dr
- 4800 Encino Terrace
- 4748 White Oak Ave
- 4756 White Oak Ave
- 4801 Encino Terrace
- 17524 Corinthian Dr
- 17515 Corinthian Dr
- 2 Dillon
- 0 W Carlisle Unit SR15229375
- 4810 Encino Terrace
- 4678 White Oak Ave
- 4722 White Oak Ave
- 4811 Encino Terrace
- 4762 White Oak Ave
- 17512 Corinthian Dr
- 4684 White Oak Ave
- 17501 Corinthian Dr
- 17520 Greenleaf St
- 4801 Encino Ave