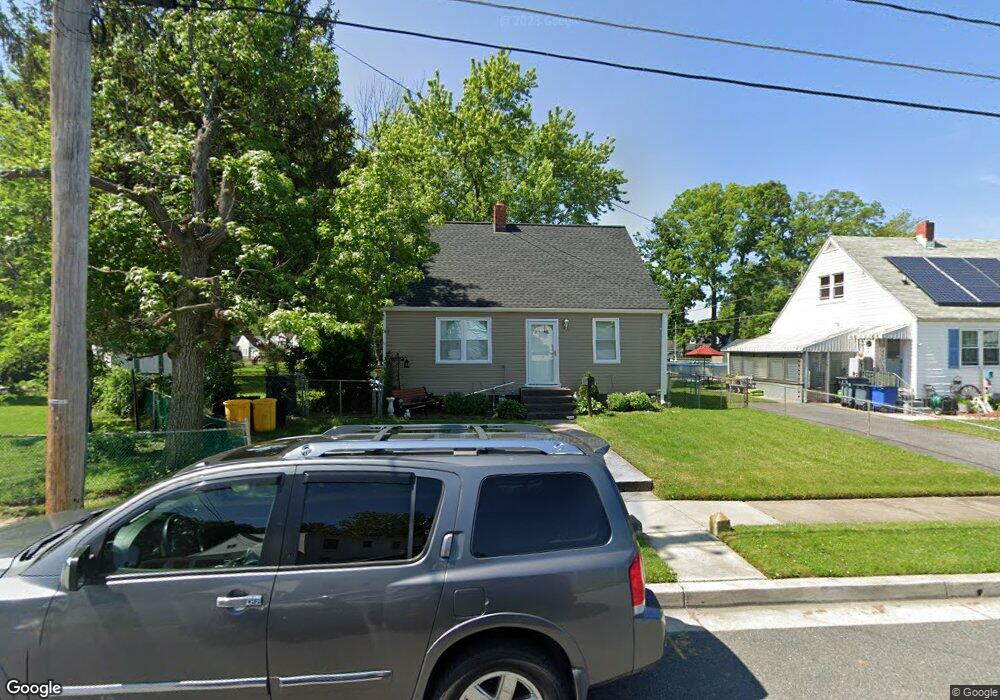
1754 Burnham Rd Dundalk, MD 21222
Estimated Value: $272,000 - $321,000
3
Beds
1
Bath
1,530
Sq Ft
$194/Sq Ft
Est. Value
About This Home
This home is located at 1754 Burnham Rd, Dundalk, MD 21222 and is currently estimated at $296,868, approximately $194 per square foot. 1754 Burnham Rd is a home located in Baltimore County with nearby schools including Edgemere Elementary School, General John Stricker Middle School, and Patapsco High & Center for Arts.
Ownership History
Date
Name
Owned For
Owner Type
Purchase Details
Closed on
Jun 21, 2011
Sold by
Dicke Maxlene W
Bought by
Rice Kriston
Current Estimated Value
Home Financials for this Owner
Home Financials are based on the most recent Mortgage that was taken out on this home.
Original Mortgage
$82,845
Outstanding Balance
$55,394
Interest Rate
4%
Mortgage Type
FHA
Estimated Equity
$241,474
Purchase Details
Closed on
Jun 1, 2011
Sold by
Dicke Dale and Dicke Dale
Bought by
Rice Kriston
Home Financials for this Owner
Home Financials are based on the most recent Mortgage that was taken out on this home.
Original Mortgage
$82,845
Outstanding Balance
$55,394
Interest Rate
4%
Mortgage Type
FHA
Estimated Equity
$241,474
Purchase Details
Closed on
Jul 16, 2001
Sold by
Dicke Leonard R
Bought by
Dicke Maxlene W
Create a Home Valuation Report for This Property
The Home Valuation Report is an in-depth analysis detailing your home's value as well as a comparison with similar homes in the area
Home Values in the Area
Average Home Value in this Area
Purchase History
| Date | Buyer | Sale Price | Title Company |
|---|---|---|---|
| Rice Kriston | $85,000 | -- | |
| Rice Kriston | $85,000 | -- | |
| Rice Kriston | $85,000 | None Available | |
| Rice Kriston | $85,000 | -- | |
| Rice Kriston | $85,000 | -- | |
| Dicke Maxlene W | -- | -- |
Source: Public Records
Mortgage History
| Date | Status | Borrower | Loan Amount |
|---|---|---|---|
| Open | Rice Kriston | $82,845 | |
| Closed | Rice Kriston | $82,845 | |
| Closed | Rice Kriston | $82,845 |
Source: Public Records
Tax History
| Year | Tax Paid | Tax Assessment Tax Assessment Total Assessment is a certain percentage of the fair market value that is determined by local assessors to be the total taxable value of land and additions on the property. | Land | Improvement |
|---|---|---|---|---|
| 2025 | $3,273 | $191,867 | -- | -- |
| 2024 | $3,273 | $176,233 | $0 | $0 |
| 2023 | $1,449 | $160,600 | $63,500 | $97,100 |
| 2022 | $2,714 | $153,267 | $0 | $0 |
| 2021 | $2,495 | $145,933 | $0 | $0 |
| 2020 | $1,680 | $138,600 | $63,500 | $75,100 |
| 2019 | $1,632 | $134,667 | $0 | $0 |
| 2018 | $2,912 | $130,733 | $0 | $0 |
| 2017 | $2,293 | $126,800 | $0 | $0 |
| 2016 | $1,846 | $126,800 | $0 | $0 |
| 2015 | $1,846 | $126,800 | $0 | $0 |
| 2014 | $1,846 | $128,400 | $0 | $0 |
Source: Public Records
Map
Nearby Homes
- 8626 Wise Ave
- 908 Meadow Ave
- 1800 Constellation Dr
- 1802 Constellation Dr
- 1804 John Stricker Ave
- 1809 Constellation Dr
- 1811 Constellation Dr
- 1824 John Stricker Ave
- 1826 John Stricker Ave
- 1813 John Stricker Ave
- 1840 John Stricker Ave
- 923 Short Rd
- 1842 John Stricker Ave
- 7865 Saint Bridget Ln
- 7512 Battle Grove Cir
- 7929 Saint Claire Ln
- 14 Beach Dr
- 9102 Wise Avenue Extension
- 8 Seabright Ave
- 7431 Saint Patricia Ct
- 1752 Burnham Rd
- 909 Meadow Ave
- 8612 Wise Ave
- 8610 Wise Ave
- 907 Meadow Ave
- 1750 Burnham Rd
- 8606 Wise Ave
- 8614 Wise Ave
- 905 Meadow Ave
- 8616 Wise Ave
- 1751 Burnham Rd
- 900 Grove Ave
- 8618 Wise Ave
- 1000 Wise Ave
- 1748 Burnham Rd
- 1707 Pin Oak Ave
- 906 Meadow Ave
- 1709 Pin Oak Ave
- 1757 Drexel Rd
- 0 Grove Ave Unit 1007990346
Your Personal Tour Guide
Ask me questions while you tour the home.