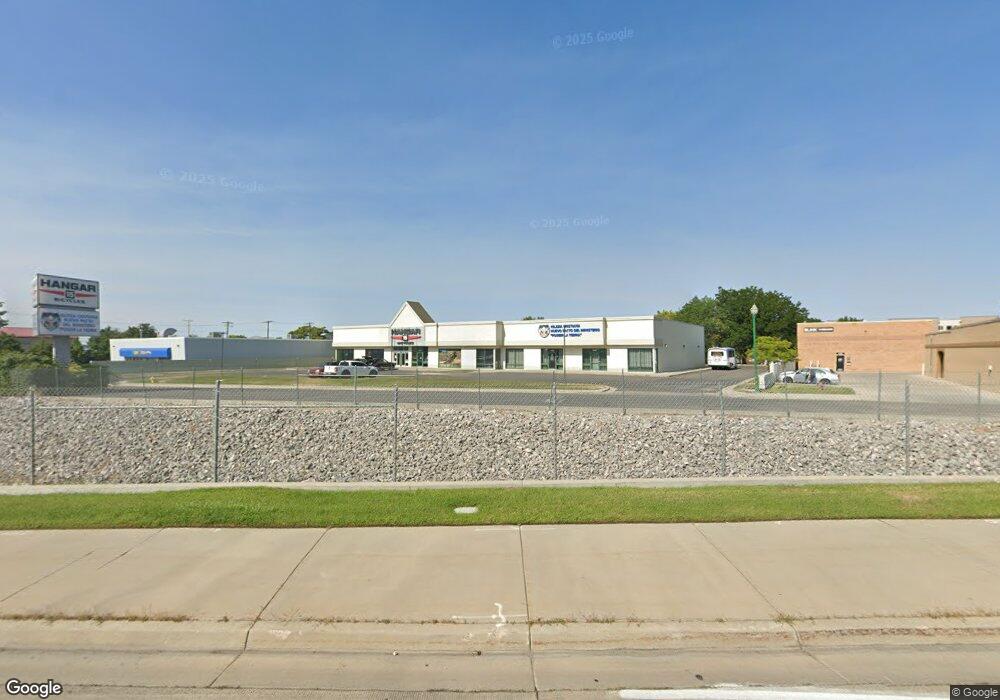
1754 S State St Orem, UT 84097
Cherry Hill Neighborhood
Studio
--
Bath
9,500
Sq Ft
54,450
Sq Ft Lot
About This Home
This home is located at 1754 S State St, Orem, UT 84097. 1754 S State St is a home located in Utah County with nearby schools including Cherry Hill Elementary School, Lakeridge Jr High School, and Mountain View High School.
Ownership History
Date
Name
Owned For
Owner Type
Purchase Details
Closed on
Nov 28, 2018
Sold by
Dahle Investments Llc
Bought by
True Enterprises Llc
Home Financials for this Owner
Home Financials are based on the most recent Mortgage that was taken out on this home.
Original Mortgage
$1,462,500
Outstanding Balance
$1,288,494
Interest Rate
4.8%
Mortgage Type
Commercial
Purchase Details
Closed on
Aug 29, 2018
Sold by
Dahle Investments Llc
Bought by
Dahle Investments Llc
Purchase Details
Closed on
Oct 24, 2013
Sold by
Dahle Investments Ltd
Bought by
Dahle Investments Llc
Create a Home Valuation Report for This Property
The Home Valuation Report is an in-depth analysis detailing your home's value as well as a comparison with similar homes in the area
Home Values in the Area
Average Home Value in this Area
Purchase History
| Date | Buyer | Sale Price | Title Company |
|---|---|---|---|
| True Enterprises Llc | -- | First American Title | |
| Dahle Investments Llc | -- | First American Title | |
| Dahle Investments Llc | -- | Accommodation |
Source: Public Records
Mortgage History
| Date | Status | Borrower | Loan Amount |
|---|---|---|---|
| Open | True Enterprises Llc | $1,462,500 |
Source: Public Records
Tax History
| Year | Tax Paid | Tax Assessment Tax Assessment Total Assessment is a certain percentage of the fair market value that is determined by local assessors to be the total taxable value of land and additions on the property. | Land | Improvement |
|---|---|---|---|---|
| 2025 | $9,699 | $1,144,400 | $342,400 | $802,000 |
| 2024 | $9,699 | $1,186,000 | $0 | $0 |
| 2023 | $8,510 | $1,118,400 | $0 | $0 |
| 2022 | $7,964 | $1,014,000 | $335,400 | $678,600 |
| 2021 | $8,398 | $890,800 | $298,300 | $592,500 |
| 2020 | $8,995 | $937,700 | $298,300 | $639,400 |
| 2019 | $8,466 | $917,700 | $276,100 | $641,600 |
| 2018 | $8,431 | $873,200 | $263,100 | $610,100 |
| 2017 | $8,392 | $846,600 | $0 | $0 |
| 2016 | $8,973 | $834,700 | $0 | $0 |
| 2015 | $9,411 | $827,900 | $0 | $0 |
| 2014 | $9,329 | $817,000 | $0 | $0 |
Source: Public Records
Map
Nearby Homes
Your Personal Tour Guide
Ask me questions while you tour the home.