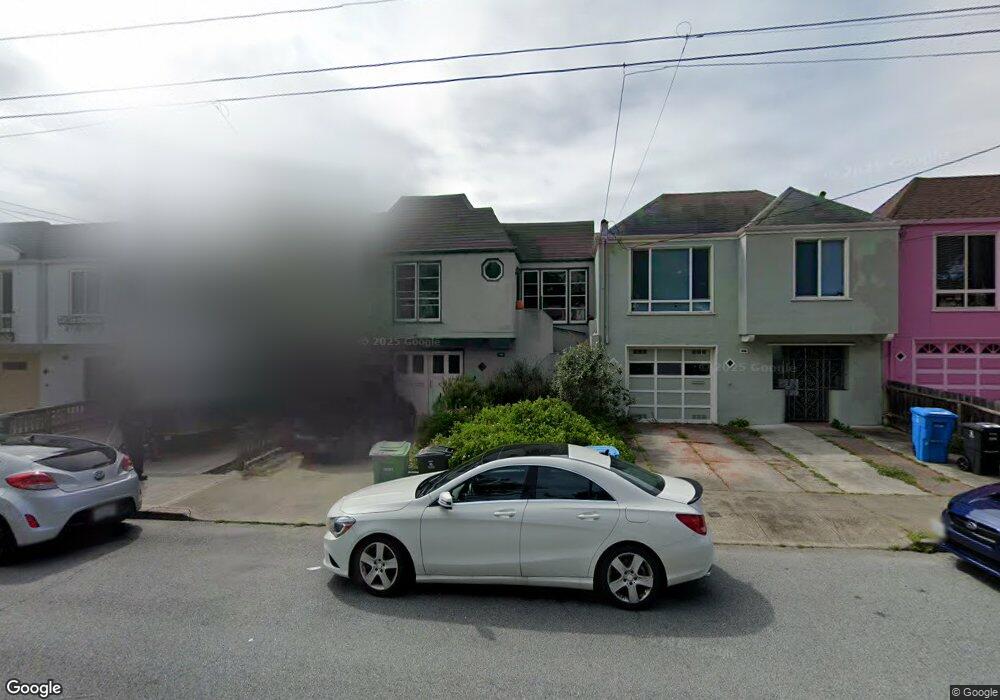
1755 37th Ave San Francisco, CA 94122
Outer Sunset NeighborhoodEstimated Value: $1,602,000 - $1,875,249
2
Beds
3
Baths
1,832
Sq Ft
$947/Sq Ft
Est. Value
About This Home
This home is located at 1755 37th Ave, San Francisco, CA 94122 and is currently estimated at $1,734,062, approximately $946 per square foot. 1755 37th Ave is a home located in San Francisco County with nearby schools including Key (Francis Scott) Elementary School, Giannini (A.P.) Middle School, and Holy Name Elementary School.
Ownership History
Date
Name
Owned For
Owner Type
Purchase Details
Closed on
Aug 22, 2019
Sold by
Silva Nicholas M
Bought by
Svizzero Christian Wong
Current Estimated Value
Home Financials for this Owner
Home Financials are based on the most recent Mortgage that was taken out on this home.
Original Mortgage
$800,000
Outstanding Balance
$694,017
Interest Rate
3.25%
Mortgage Type
Adjustable Rate Mortgage/ARM
Estimated Equity
$1,040,045
Purchase Details
Closed on
Feb 7, 2002
Sold by
Silva Frederic A and Silva Kristine I
Bought by
Silva Nicholas M
Create a Home Valuation Report for This Property
The Home Valuation Report is an in-depth analysis detailing your home's value as well as a comparison with similar homes in the area
Home Values in the Area
Average Home Value in this Area
Purchase History
| Date | Buyer | Sale Price | Title Company |
|---|---|---|---|
| Svizzero Christian Wong | $1,200,000 | Fidelity Natl Ttl Co Concord | |
| Silva Nicholas M | -- | -- | |
| Silva Frederic A | -- | -- |
Source: Public Records
Mortgage History
| Date | Status | Borrower | Loan Amount |
|---|---|---|---|
| Open | Svizzero Christian Wong | $800,000 |
Source: Public Records
Tax History Compared to Growth
Tax History
| Year | Tax Paid | Tax Assessment Tax Assessment Total Assessment is a certain percentage of the fair market value that is determined by local assessors to be the total taxable value of land and additions on the property. | Land | Improvement |
|---|---|---|---|---|
| 2025 | $19,978 | $1,661,511 | $1,033,493 | $628,018 |
| 2024 | $19,978 | $1,628,934 | $1,013,229 | $615,705 |
| 2023 | $19,634 | $1,596,995 | $993,362 | $603,633 |
| 2022 | $19,256 | $1,565,683 | $973,885 | $591,798 |
| 2021 | $18,917 | $1,534,985 | $954,790 | $580,195 |
| 2020 | $17,021 | $1,350,000 | $945,000 | $405,000 |
| 2019 | $4,134 | $280,650 | $119,419 | $161,231 |
| 2018 | $3,995 | $275,148 | $117,078 | $158,070 |
| 2017 | $3,651 | $269,754 | $114,783 | $154,971 |
| 2016 | $3,563 | $264,466 | $112,533 | $151,933 |
| 2015 | $3,515 | $260,494 | $110,843 | $149,651 |
| 2014 | $3,425 | $255,392 | $108,672 | $146,720 |
Source: Public Records
Map
Nearby Homes