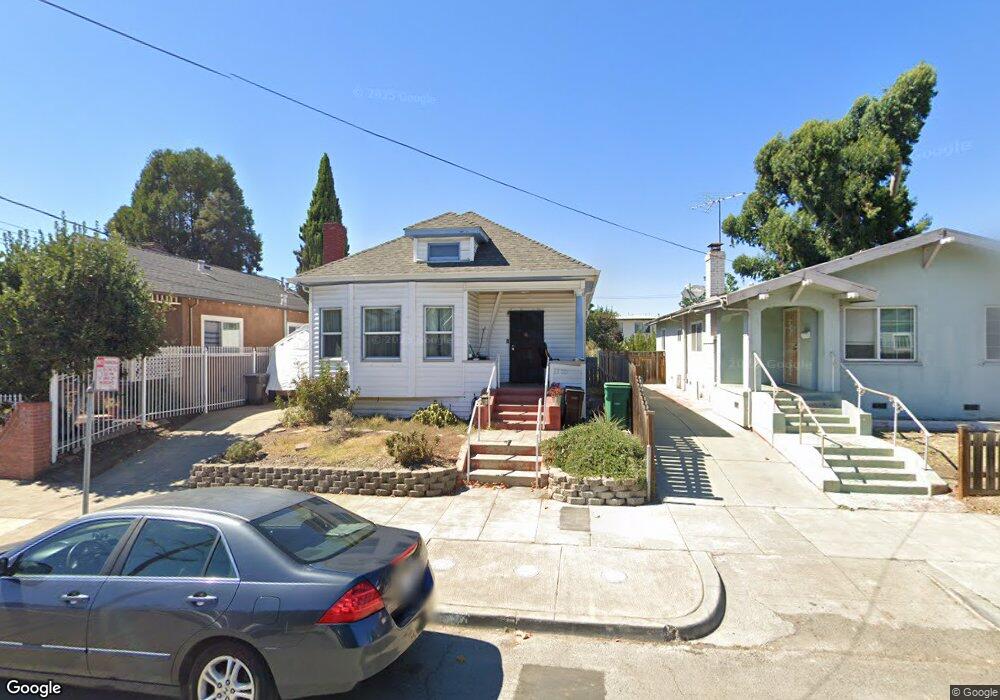
1755 83rd Ave Oakland, CA 94621
Webster NeighborhoodEstimated Value: $406,000 - $484,000
2
Beds
1
Bath
956
Sq Ft
$479/Sq Ft
Est. Value
About This Home
This home is located at 1755 83rd Ave, Oakland, CA 94621 and is currently estimated at $457,809, approximately $478 per square foot. 1755 83rd Ave is a home located in Alameda County with nearby schools including East Oakland Pride Elementary School, Coliseum College Prep Academy, and Frick United Academy of Language.
Ownership History
Date
Name
Owned For
Owner Type
Purchase Details
Closed on
Apr 5, 2018
Sold by
Stinson Pauline
Bought by
Carter Shomari
Current Estimated Value
Home Financials for this Owner
Home Financials are based on the most recent Mortgage that was taken out on this home.
Original Mortgage
$365,000
Outstanding Balance
$313,602
Interest Rate
4.4%
Mortgage Type
VA
Estimated Equity
$144,207
Create a Home Valuation Report for This Property
The Home Valuation Report is an in-depth analysis detailing your home's value as well as a comparison with similar homes in the area
Home Values in the Area
Average Home Value in this Area
Purchase History
| Date | Buyer | Sale Price | Title Company |
|---|---|---|---|
| Carter Shomari | $395,000 | First American Title Company |
Source: Public Records
Mortgage History
| Date | Status | Borrower | Loan Amount |
|---|---|---|---|
| Open | Carter Shomari | $365,000 |
Source: Public Records
Tax History
| Year | Tax Paid | Tax Assessment Tax Assessment Total Assessment is a certain percentage of the fair market value that is determined by local assessors to be the total taxable value of land and additions on the property. | Land | Improvement |
|---|---|---|---|---|
| 2025 | $8,384 | $449,434 | $134,830 | $314,604 |
| 2024 | $8,384 | $440,621 | $132,186 | $308,435 |
| 2023 | $8,975 | $431,983 | $129,595 | $302,388 |
| 2022 | $8,708 | $423,514 | $127,054 | $296,460 |
| 2021 | $8,426 | $415,211 | $124,563 | $290,648 |
| 2020 | $8,057 | $410,957 | $123,287 | $287,670 |
| 2019 | $6,811 | $402,900 | $120,870 | $282,030 |
| 2018 | $1,655 | $35,123 | $19,824 | $15,299 |
| 2017 | $1,550 | $34,434 | $19,435 | $14,999 |
| 2016 | $1,394 | $33,759 | $19,054 | $14,705 |
| 2015 | $1,543 | $33,252 | $18,768 | $14,484 |
| 2014 | $1,214 | $32,600 | $18,400 | $14,200 |
Source: Public Records
Map
Nearby Homes
Your Personal Tour Guide
Ask me questions while you tour the home.