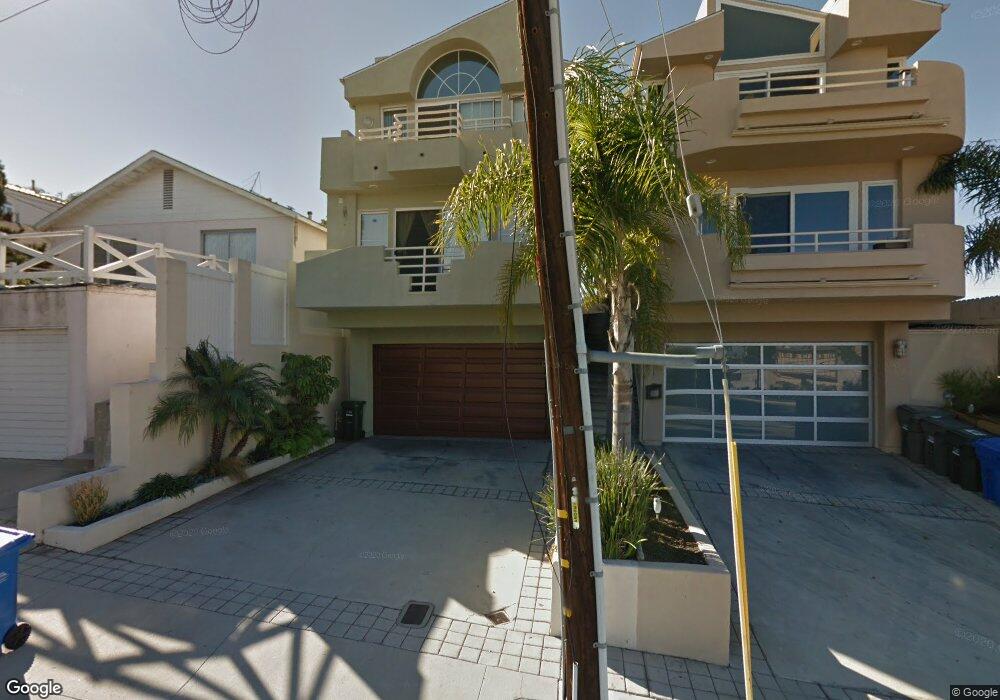
1755 Carver St Redondo Beach, CA 90278
North Redondo Beach NeighborhoodEstimated Value: $1,732,000 - $1,873,000
3
Beds
3
Baths
2,432
Sq Ft
$740/Sq Ft
Est. Value
About This Home
This home is located at 1755 Carver St, Redondo Beach, CA 90278 and is currently estimated at $1,798,848, approximately $739 per square foot. 1755 Carver St is a home located in Los Angeles County with nearby schools including Birney Elementary School, Adams Middle School, and Redondo Union High School.
Ownership History
Date
Name
Owned For
Owner Type
Purchase Details
Closed on
Jun 28, 2012
Sold by
Merriman Kenneth D
Bought by
Merriman Hillary Gardner
Current Estimated Value
Home Financials for this Owner
Home Financials are based on the most recent Mortgage that was taken out on this home.
Original Mortgage
$938,250
Outstanding Balance
$646,126
Interest Rate
3.62%
Mortgage Type
Reverse Mortgage Home Equity Conversion Mortgage
Estimated Equity
$1,152,722
Purchase Details
Closed on
Oct 24, 2001
Sold by
Cruz Joaquin A
Bought by
Merriman Kenneth D
Home Financials for this Owner
Home Financials are based on the most recent Mortgage that was taken out on this home.
Original Mortgage
$388,000
Interest Rate
6%
Purchase Details
Closed on
Feb 1, 1995
Sold by
Replogle David Elmo and Replogle Barlene Emily
Bought by
Cruz Joaquin A
Purchase Details
Closed on
Dec 14, 1994
Sold by
Morgan Marcela J
Bought by
Replogle David Elmo
Create a Home Valuation Report for This Property
The Home Valuation Report is an in-depth analysis detailing your home's value as well as a comparison with similar homes in the area
Home Values in the Area
Average Home Value in this Area
Purchase History
| Date | Buyer | Sale Price | Title Company |
|---|---|---|---|
| Merriman Hillary Gardner | -- | Placer Title Company | |
| Merriman Kenneth D | $485,000 | Fidelity National Title Co | |
| Cruz Joaquin A | -- | Continental Lawyers Title Co | |
| Replogle David Elmo | -- | Continental Lawyers Title Co |
Source: Public Records
Mortgage History
| Date | Status | Borrower | Loan Amount |
|---|---|---|---|
| Open | Merriman Hillary Gardner | $938,250 | |
| Closed | Merriman Kenneth D | $388,000 |
Source: Public Records
Tax History Compared to Growth
Tax History
| Year | Tax Paid | Tax Assessment Tax Assessment Total Assessment is a certain percentage of the fair market value that is determined by local assessors to be the total taxable value of land and additions on the property. | Land | Improvement |
|---|---|---|---|---|
| 2025 | $8,641 | $716,471 | $484,841 | $231,630 |
| 2024 | $8,641 | $702,424 | $475,335 | $227,089 |
| 2023 | $8,488 | $688,652 | $466,015 | $222,637 |
| 2022 | $8,331 | $675,150 | $456,878 | $218,272 |
| 2021 | $8,100 | $661,913 | $447,920 | $213,993 |
| 2019 | $7,900 | $642,283 | $434,636 | $207,647 |
| 2018 | $7,677 | $629,690 | $426,114 | $203,576 |
| 2016 | $7,414 | $605,240 | $409,568 | $195,672 |
| 2015 | $7,281 | $596,149 | $403,416 | $192,733 |
| 2014 | $7,176 | $584,472 | $395,514 | $188,958 |
Source: Public Records
Map
Nearby Homes
- 1752 Dixon St
- 1544 Mathews Ave
- 1758 Reed St
- 1742 Reed St
- 1717 Axenty Way
- 1756 Ruhland Ave
- 1736 Voorhees Ave
- 1536 Wollacott St
- 1513 Carver St
- 1620 Harper Ave
- 1612 Gates Ave
- 1900 Vanderbilt Ln
- 1223 19th St
- 2306 Aviation Blvd Unit A
- 207 S Aviation Blvd
- 2025 Prospect Ave
- 1902 Gates Ave
- 2001 Artesia Blvd Unit 301
- 2001 Artesia Blvd Unit 207
- 1706 2nd St