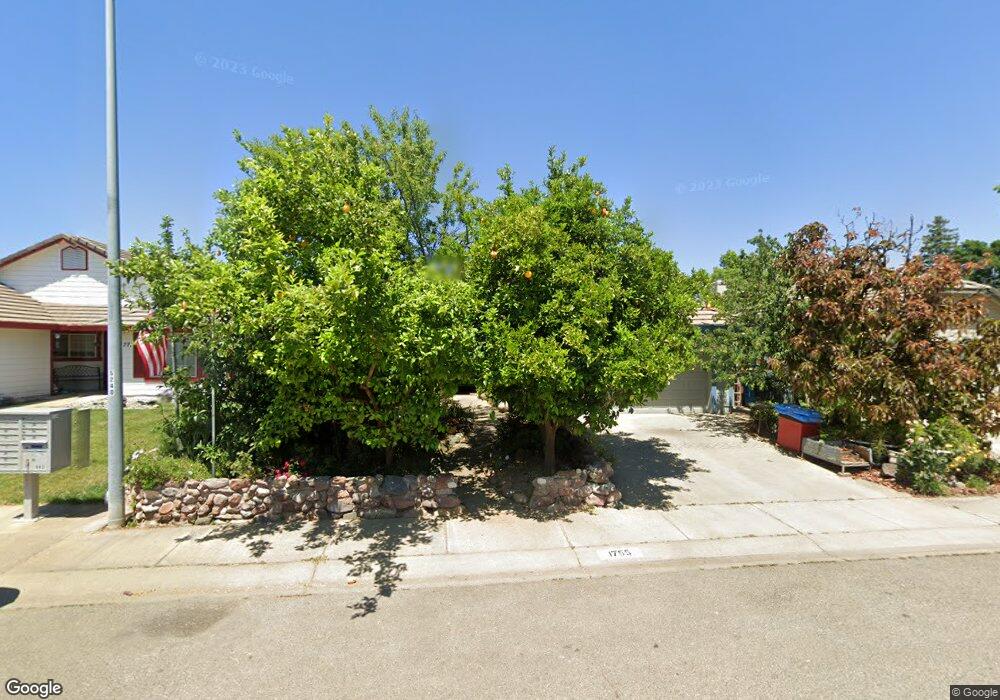
1755 Deerfield Dr Yuba City, CA 95993
Estimated Value: $307,000 - $386,000
3
Beds
2
Baths
1,306
Sq Ft
$273/Sq Ft
Est. Value
About This Home
This home is located at 1755 Deerfield Dr, Yuba City, CA 95993 and is currently estimated at $356,219, approximately $272 per square foot. 1755 Deerfield Dr is a home located in Sutter County with nearby schools including Andros Karperos, River Valley High School, and Pathways Charter Academy.
Ownership History
Date
Name
Owned For
Owner Type
Purchase Details
Closed on
May 25, 2017
Sold by
Perez Rojelio A
Bought by
Perez Rojelio A and Perez Roy Lee
Current Estimated Value
Purchase Details
Closed on
May 15, 2017
Sold by
Perez Rojelio A
Bought by
Perez Rojelio A and Perez Roy Lee
Purchase Details
Closed on
Jun 18, 2007
Sold by
Perez Rojelio A
Bought by
Perez Rojelio A and Perez Veronica Mary
Purchase Details
Closed on
Jun 20, 2000
Sold by
Wyche Deborah M and Wyche Deborah M
Bought by
Perez Rojelio A
Home Financials for this Owner
Home Financials are based on the most recent Mortgage that was taken out on this home.
Original Mortgage
$87,200
Outstanding Balance
$31,420
Interest Rate
8.53%
Estimated Equity
$324,799
Purchase Details
Closed on
Mar 24, 2000
Sold by
Bryant Robert A and Bryant Kathrine D
Bought by
Bryant Debra Patricia and Bryant Craig Robert
Create a Home Valuation Report for This Property
The Home Valuation Report is an in-depth analysis detailing your home's value as well as a comparison with similar homes in the area
Home Values in the Area
Average Home Value in this Area
Purchase History
| Date | Buyer | Sale Price | Title Company |
|---|---|---|---|
| Perez Rojelio A | -- | None Available | |
| Perez Rojelio A | -- | None Available | |
| Perez Rojelio A | -- | None Available | |
| Perez Rojelio A | $109,000 | First American Title Ins Co | |
| Wilcox Deborah M | -- | First American Title Ins Co | |
| Bryant Debra Patricia | -- | -- |
Source: Public Records
Mortgage History
| Date | Status | Borrower | Loan Amount |
|---|---|---|---|
| Open | Perez Rojelio A | $87,200 |
Source: Public Records
Tax History Compared to Growth
Tax History
| Year | Tax Paid | Tax Assessment Tax Assessment Total Assessment is a certain percentage of the fair market value that is determined by local assessors to be the total taxable value of land and additions on the property. | Land | Improvement |
|---|---|---|---|---|
| 2025 | $1,793 | $167,508 | $38,413 | $129,095 |
| 2024 | $1,793 | $164,224 | $37,660 | $126,564 |
| 2023 | $1,793 | $161,005 | $36,922 | $124,083 |
| 2022 | $2,233 | $157,849 | $36,199 | $121,650 |
| 2021 | $2,202 | $154,774 | $35,499 | $119,275 |
| 2020 | $2,174 | $153,187 | $35,135 | $118,052 |
| 2019 | $2,136 | $150,183 | $34,446 | $115,737 |
| 2018 | $2,103 | $147,237 | $33,770 | $113,467 |
| 2017 | $2,062 | $144,350 | $33,108 | $111,242 |
| 2016 | $2,029 | $141,520 | $32,459 | $109,061 |
| 2015 | $2,001 | $139,394 | $31,971 | $107,423 |
| 2014 | $1,971 | $136,663 | $31,345 | $105,318 |
Source: Public Records
Map
Nearby Homes
- 683 Mark Thomas Dr
- 1781 Franklin Rd Unit 36
- 1781 Franklin Rd Unit 59
- 1923 Hardial Dr
- 138 Nantucket Way
- 152 College Hill Way
- 156 Bristol Way
- 170 Nantucket Way
- 430 Neil Dr
- 1665 Michelle Dr
- 1955 Jason Ct
- 955 Carson Dr
- 0 Lassen Blvd
- 238 Anita Way
- 1514 Countryside Dr
- 1344 Kean Ave
- 1545 Camino Del Oro
- 1330 Kean Ave
- 1571 Holly Tree Dr
- 4520 Us-99
- 1771 Deerfield Dr
- 1741 Deerfield Dr
- 524 Willowbrook Dr
- 1785 Deerfield Dr
- 525 Tharp Rd
- 534 Willowbrook Dr
- 1750 Deerfield Dr
- 533 Tharp Rd
- 1764 Deerfield Dr
- 1738 Deerfield Dr
- 1778 Deerfield Dr
- 542 Willowbrook Dr
- 541 Tharp Rd
- 517 Willowbrook Dr
- 509 Willowbrook Dr
- 1724 Deerfield Dr
- 525 Willowbrook Dr
- 1792 Deerfield Dr
- 501 Willowbrook Dr
- 552 Willowbrook Dr