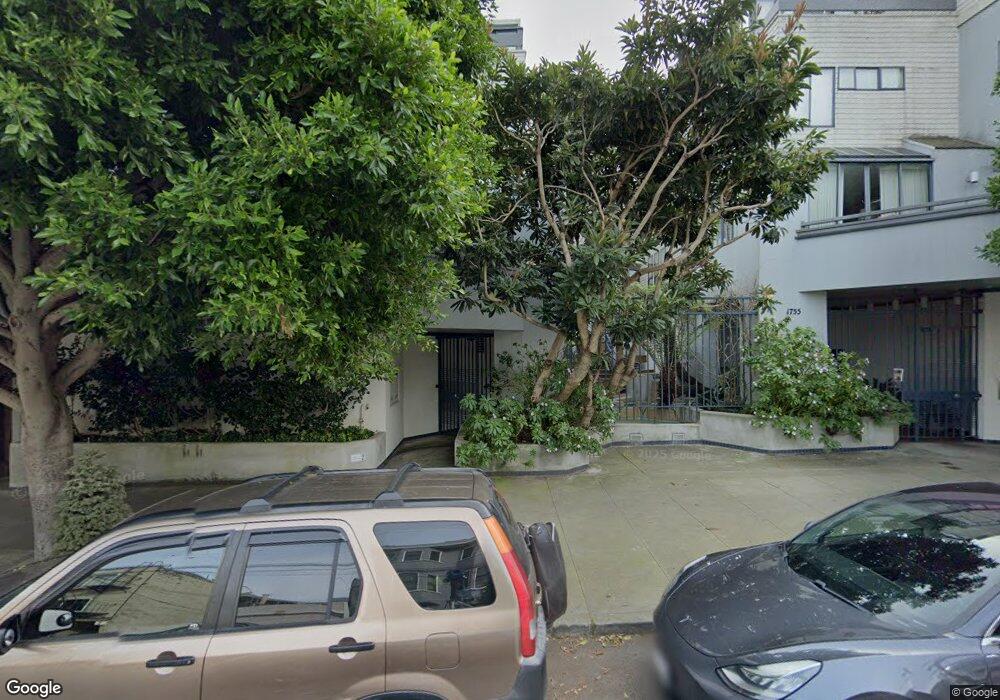
1755 Filbert St Unit 20 San Francisco, CA 94123
Cow Hollow NeighborhoodEstimated Value: $1,601,000 - $2,255,000
2
Beds
2
Baths
1,737
Sq Ft
$1,124/Sq Ft
Est. Value
About This Home
This home is located at 1755 Filbert St Unit 20, San Francisco, CA 94123 and is currently estimated at $1,953,187, approximately $1,124 per square foot. 1755 Filbert St Unit 20 is a home located in San Francisco County with nearby schools including Sherman Elementary, Marina Middle School, and Saint Brigid Academy.
Ownership History
Date
Name
Owned For
Owner Type
Purchase Details
Closed on
Apr 12, 2006
Sold by
Muir Michael and Muir Kandice
Bought by
Seiferle Paul and Seiferle Joanne
Current Estimated Value
Home Financials for this Owner
Home Financials are based on the most recent Mortgage that was taken out on this home.
Original Mortgage
$900,000
Outstanding Balance
$487,157
Interest Rate
5.37%
Mortgage Type
Purchase Money Mortgage
Estimated Equity
$1,466,030
Purchase Details
Closed on
Sep 10, 2004
Sold by
Muir Michael Neal
Bought by
Muir Michael and Muir Kandice
Purchase Details
Closed on
Apr 19, 2003
Sold by
Buckeldee Kandice
Bought by
Muir Michael Neal
Home Financials for this Owner
Home Financials are based on the most recent Mortgage that was taken out on this home.
Original Mortgage
$250,000
Interest Rate
4.76%
Mortgage Type
Purchase Money Mortgage
Purchase Details
Closed on
Jun 27, 1995
Sold by
Mcelfresh William Loren and Mcelfresh Bonnie R
Bought by
Muir Michael Neal
Home Financials for this Owner
Home Financials are based on the most recent Mortgage that was taken out on this home.
Original Mortgage
$370,400
Interest Rate
7.62%
Create a Home Valuation Report for This Property
The Home Valuation Report is an in-depth analysis detailing your home's value as well as a comparison with similar homes in the area
Home Values in the Area
Average Home Value in this Area
Purchase History
| Date | Buyer | Sale Price | Title Company |
|---|---|---|---|
| Seiferle Paul | $1,125,000 | Fidelity National Title Co | |
| Muir Michael | -- | -- | |
| Muir Michael Neal | -- | First American Title Company | |
| Muir Michael Neal | $463,000 | First American Title Company |
Source: Public Records
Mortgage History
| Date | Status | Borrower | Loan Amount |
|---|---|---|---|
| Open | Seiferle Paul | $900,000 | |
| Previous Owner | Muir Michael Neal | $250,000 | |
| Previous Owner | Muir Michael Neal | $370,400 |
Source: Public Records
Tax History Compared to Growth
Tax History
| Year | Tax Paid | Tax Assessment Tax Assessment Total Assessment is a certain percentage of the fair market value that is determined by local assessors to be the total taxable value of land and additions on the property. | Land | Improvement |
|---|---|---|---|---|
| 2025 | $18,924 | $1,576,555 | $768,695 | $807,860 |
| 2024 | $18,924 | $1,545,644 | $753,623 | $792,021 |
| 2023 | $18,632 | $1,515,340 | $738,847 | $776,493 |
| 2022 | $18,277 | $1,485,628 | $724,360 | $761,268 |
| 2021 | $17,954 | $1,456,499 | $710,157 | $746,342 |
| 2020 | $18,034 | $1,441,567 | $702,876 | $738,691 |
| 2019 | $17,416 | $1,413,303 | $689,095 | $724,208 |
| 2018 | $16,830 | $1,385,593 | $675,584 | $710,009 |
| 2017 | $15,938 | $1,324,676 | $662,338 | $662,338 |
| 2016 | $15,684 | $1,298,702 | $649,351 | $649,351 |
| 2015 | $15,490 | $1,279,196 | $639,598 | $639,598 |
| 2014 | $15,083 | $1,254,140 | $627,070 | $627,070 |
Source: Public Records
Map
Nearby Homes
- 1776 Green St Unit 201
- 2949 Octavia St Unit 2951
- 1671 Greenwich St
- 2918 Gough St
- 32 Harris Place
- 1601 Lombard St
- 1864 Greenwich St
- 1568 Union St Unit 301
- 1630 Lombard St
- 3110 Octavia St
- 2429 Franklin St
- 1501 Filbert St Unit PH7F
- 2525 Van Ness Ave Unit 502
- 2525 Van Ness Ave Unit 601
- 1998 Vallejo St Unit 2
- 1940 Broadway Unit 2W
- 1940 Broadway Unit 8
- 1990 Green St Unit 207
- 1842 Lombard St
- 2315 Van Ness Ave Unit 8
- 1755 Filbert St Unit 2C
- 1755 Filbert St Unit 1U
- 1755 Filbert St Unit 1E
- 1755 Filbert St Unit 1S
- 1755 Filbert St Unit 191E
- 1755 Filbert St Unit 1J
- 1755 Filbert St Unit 19
- 1755 Filbert St Unit 17
- 1755 Filbert St Unit 16
- 1755 Filbert St Unit 15
- 1755 Filbert St Unit 13
- 1755 Filbert St Unit 10
- 1755 Filbert St Unit 9
- 1755 Filbert St
- 1755 Filbert St Unit 7
- 1755 Filbert St Unit 2
- 1755 Filbert St Unit 27
- 1755 Filbert St Unit 25
- 1755 Filbert St Unit 24
- 1755 Filbert St Unit 21