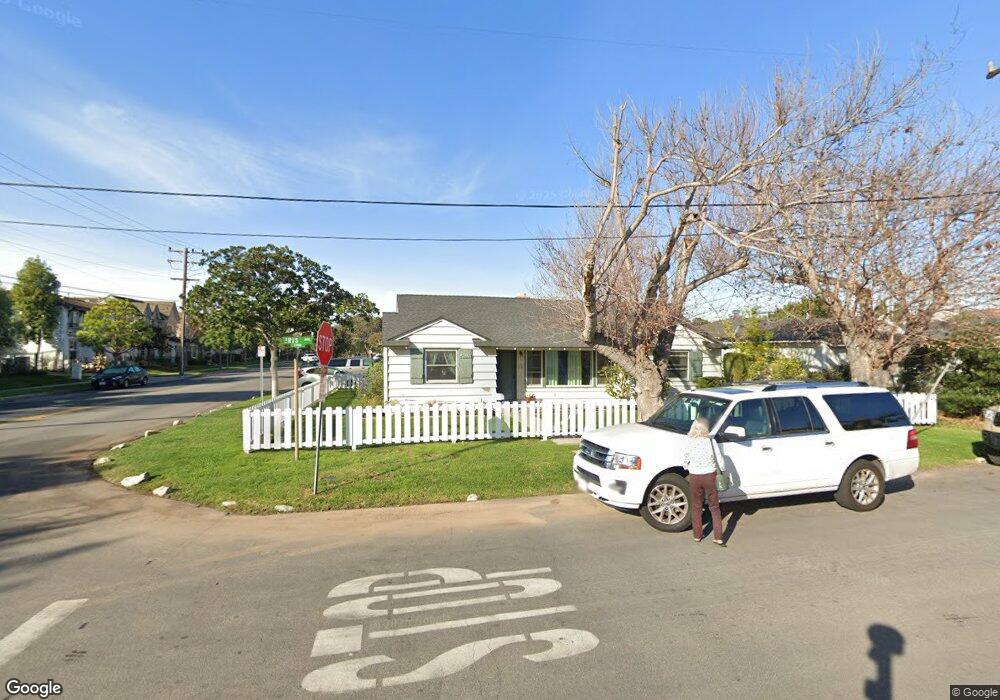
1755 Iris Ave Torrance, CA 90503
Central Torrance NeighborhoodEstimated Value: $1,142,798 - $1,322,000
3
Beds
2
Baths
1,455
Sq Ft
$857/Sq Ft
Est. Value
About This Home
This home is located at 1755 Iris Ave, Torrance, CA 90503 and is currently estimated at $1,247,200, approximately $857 per square foot. 1755 Iris Ave is a home located in Los Angeles County with nearby schools including Fern Elementary School, Madrona Middle School, and Torrance High School.
Ownership History
Date
Name
Owned For
Owner Type
Purchase Details
Closed on
May 24, 2009
Sold by
Farias Joseph
Bought by
Hamaya Hiroaki and Hamaya Saeko Yvette
Current Estimated Value
Home Financials for this Owner
Home Financials are based on the most recent Mortgage that was taken out on this home.
Original Mortgage
$413,000
Outstanding Balance
$259,958
Interest Rate
4.78%
Mortgage Type
Purchase Money Mortgage
Estimated Equity
$987,242
Purchase Details
Closed on
Nov 29, 2000
Sold by
Clayton Eric A
Bought by
Farias Joseph and Leonard Deborah
Home Financials for this Owner
Home Financials are based on the most recent Mortgage that was taken out on this home.
Original Mortgage
$243,750
Interest Rate
7.71%
Purchase Details
Closed on
Oct 26, 1993
Sold by
Sven Mark L
Bought by
Clayton Eric Anthony and Clayton Rosemarie
Home Financials for this Owner
Home Financials are based on the most recent Mortgage that was taken out on this home.
Original Mortgage
$180,000
Interest Rate
6.95%
Create a Home Valuation Report for This Property
The Home Valuation Report is an in-depth analysis detailing your home's value as well as a comparison with similar homes in the area
Home Values in the Area
Average Home Value in this Area
Purchase History
| Date | Buyer | Sale Price | Title Company |
|---|---|---|---|
| Hamaya Hiroaki | $582,500 | First American Title | |
| Farias Joseph | $325,000 | Southland Title Corporation | |
| Clayton Eric Anthony | -- | Southland Title | |
| Clayton Eric Anthony | $225,000 | First American Title Company |
Source: Public Records
Mortgage History
| Date | Status | Borrower | Loan Amount |
|---|---|---|---|
| Open | Hamaya Hiroaki | $413,000 | |
| Previous Owner | Farias Joseph | $243,750 | |
| Previous Owner | Clayton Eric Anthony | $180,000 |
Source: Public Records
Tax History
| Year | Tax Paid | Tax Assessment Tax Assessment Total Assessment is a certain percentage of the fair market value that is determined by local assessors to be the total taxable value of land and additions on the property. | Land | Improvement |
|---|---|---|---|---|
| 2025 | $8,489 | $750,105 | $600,090 | $150,015 |
| 2024 | $8,489 | $735,398 | $588,324 | $147,074 |
| 2023 | $8,332 | $720,980 | $576,789 | $144,191 |
| 2022 | $8,219 | $706,844 | $565,480 | $141,364 |
| 2021 | $8,069 | $692,986 | $554,393 | $138,593 |
| 2019 | $7,834 | $672,433 | $537,950 | $134,483 |
| 2018 | $7,596 | $659,249 | $527,402 | $131,847 |
| 2016 | $7,258 | $633,651 | $506,923 | $126,728 |
| 2015 | $7,100 | $624,134 | $499,309 | $124,825 |
| 2014 | $6,913 | $611,909 | $489,529 | $122,380 |
Source: Public Records
Map
Nearby Homes
- 2940 W Carson St Unit 213
- 2751 Sonoma St
- 2595 Plaza Del Amo Unit 424
- 2300 Maple Ave Unit 80
- 2300 Maple Ave Unit 140
- 2300 Maple Ave Unit 58
- 2300 Maple Ave Unit 26
- 2571 Plaza Del Amo Unit 107
- 2128 Shelburne Way
- 1307 Greenwood Ave
- 1325 Florwood Ave
- 3120 Sepulveda Blvd Unit 412
- 3120 Sepulveda Blvd Unit 306
- 2605 Sepulveda Blvd Unit 216
- 2349 Jefferson St Unit 313
- 1800 Oak St Unit 350
- 2325 W Carson St
- 22741 Nadine Cir Unit B
- 22843 Nadine Cir Unit B
- 22934 Nadine Cir Unit B
- 1751 Iris Ave
- 2811 Monterey St
- 1042 Monterey St
- 2773 Monterey St
- 1741 Iris Ave
- 2825 Monterey St
- 2827 Monterey St
- 2769 Monterey St
- 1735 Iris Ave
- 2829 Monterey St
- 1744 Iris Ave
- 1746 Juniper Ave
- 1748 S Juniper Ave
- 1740 Iris Ave
- 1742 Juniper Ave
- 2765 Monterey St
- 2831 Monterey St
- 1731 Iris Ave
- 1738 Iris Ave
- 1736 Iris Ave Unit 1
Your Personal Tour Guide
Ask me questions while you tour the home.