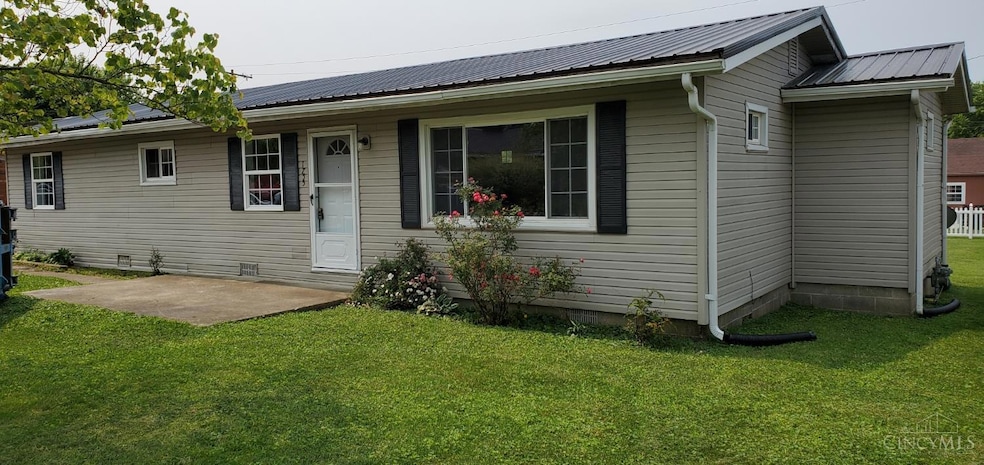
1755 Ridgeway Rd Aberdeen, OH 45101
Estimated payment $895/month
Highlights
- Boating
- River View
- No HOA
- Fishing
- Ranch Style House
- Double Pane Windows
About This Home
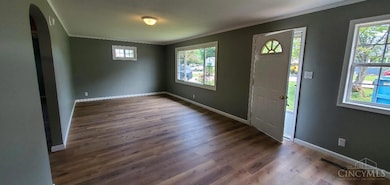
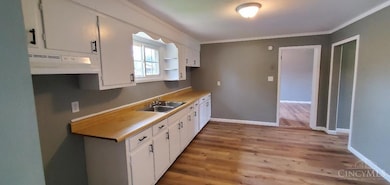
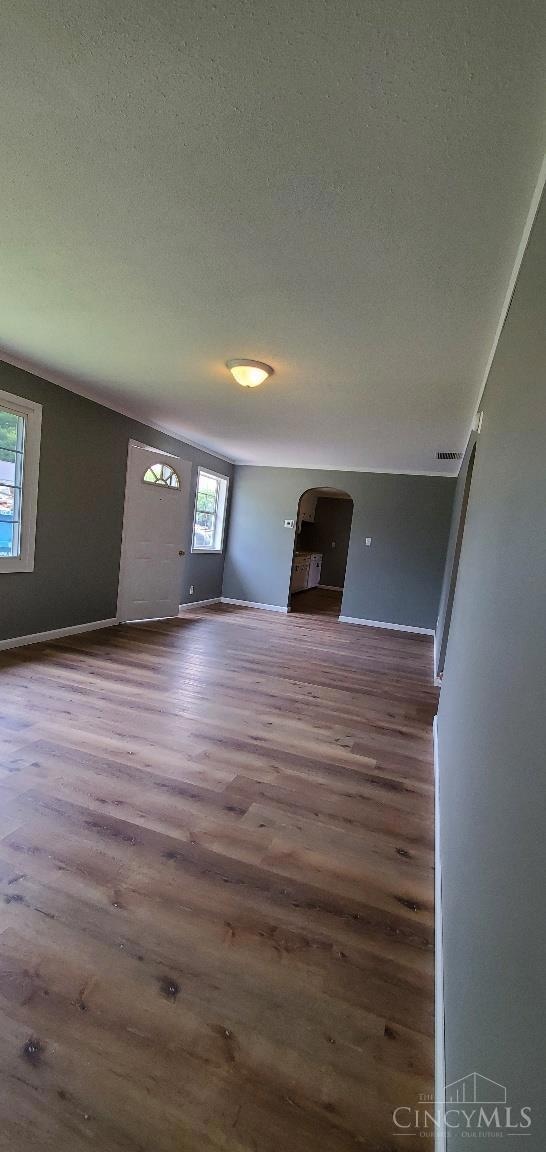
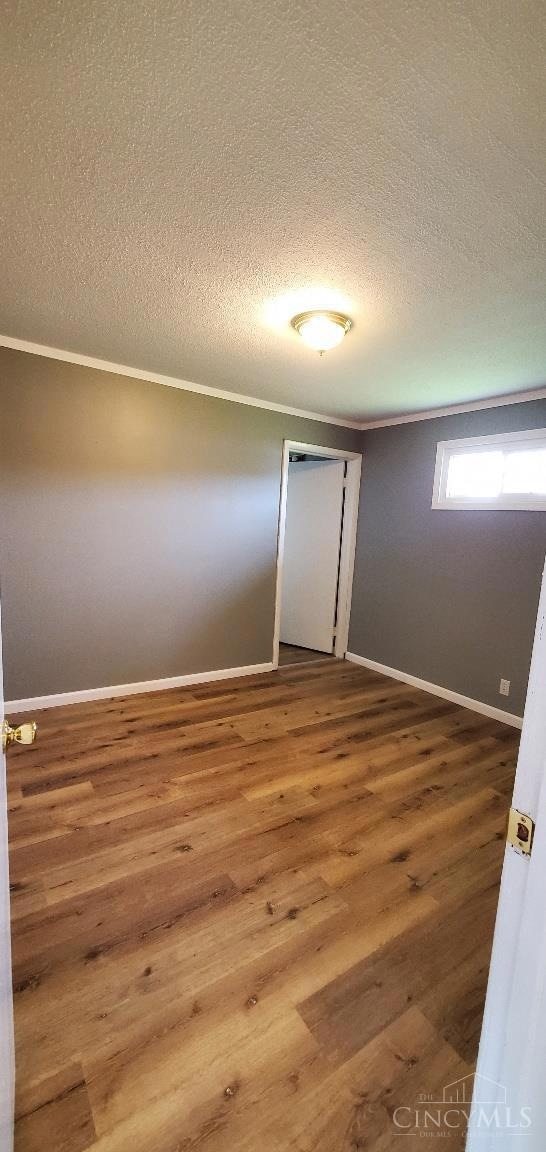
Great starter home, 3 nice size bedrooms, and 2 bathrooms. Home has large living room and is move in ready. Freshly painted, new flooring, new HVAC unit and newer metal roof. Walking distance to the Ohio River or a short drive to downtown Maysville, KY. Call Jay At 513 403 7909
Home Details
Home Type
- Single Family
Est. Annual Taxes
- $1,000
Year Built
- Built in 1957
Lot Details
- 9,374 Sq Ft Lot
- Privacy Fence
- Wire Fence
- Level Lot
Property Views
- River
- City
Home Design
- Ranch Style House
- Block Foundation
- Metal Roof
- Vinyl Siding
Interior Spaces
- 1,284 Sq Ft Home
- Double Pane Windows
- Vinyl Clad Windows
- Laminate Flooring
- Crawl Space
- Fire and Smoke Detector
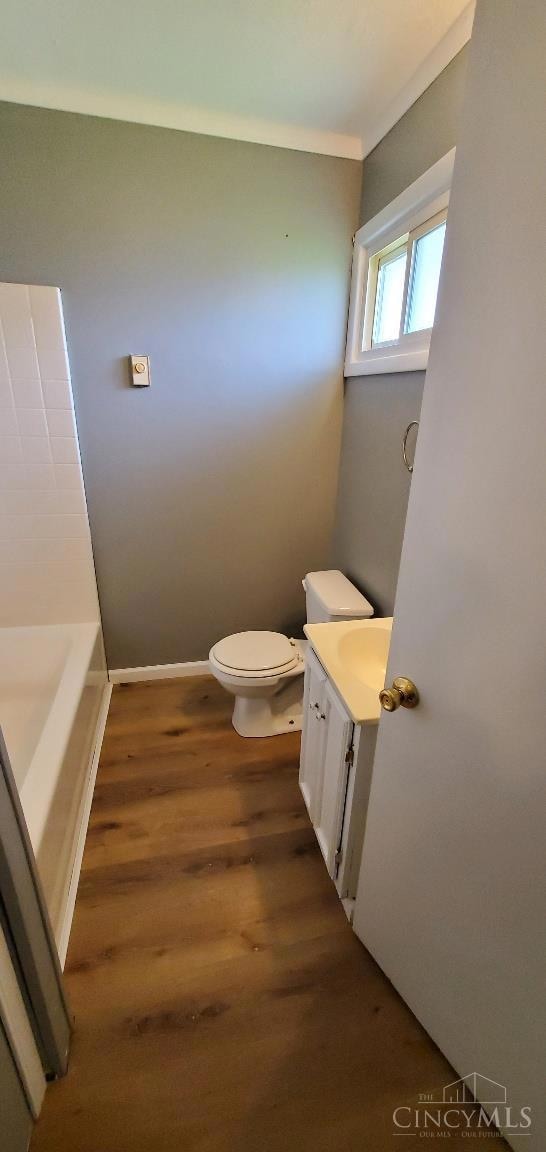
- Solid Wood Cabinet
Bedrooms and Bathrooms
- 3 Bedrooms
- Walk-In Closet
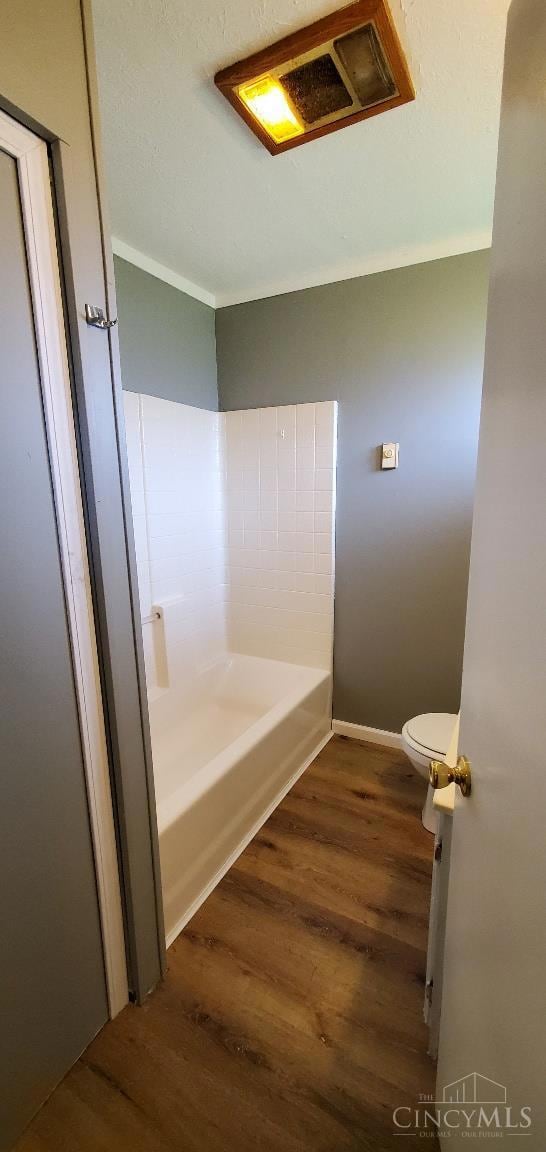
- 2 Full Bathrooms
- Bathtub with Shower
Parking
- Driveway
- Off-Street Parking
Utilities
- 95% Forced Air Zoned Heating and Cooling System
- Electric Water Heater
- Cable TV Available
Community Details
Overview
- No Home Owners Association
Recreation
- Boating
- Fishing
- Trails
Map
Home Values in the Area
Average Home Value in this Area
Tax History
| Year | Tax Paid | Tax Assessment Tax Assessment Total Assessment is a certain percentage of the fair market value that is determined by local assessors to be the total taxable value of land and additions on the property. | Land | Improvement |
|---|---|---|---|---|
| 2024 | $1,001 | $28,240 | $4,210 | $24,030 |
| 2023 | $1,001 | $22,830 | $3,330 | $19,500 |
| 2022 | $914 | $22,830 | $3,330 | $19,500 |
| 2021 | $907 | $22,830 | $3,330 | $19,500 |
| 2020 | $832 | $19,850 | $2,890 | $16,960 |
| 2019 | $827 | $19,850 | $2,890 | $16,960 |
| 2018 | $721 | $19,850 | $2,890 | $16,960 |
| 2017 | $714 | $19,250 | $3,180 | $16,070 |
| 2016 | $713 | $19,250 | $3,180 | $16,070 |
| 2015 | $733 | $19,250 | $3,180 | $16,070 |
| 2014 | $733 | $18,960 | $2,890 | $16,070 |
| 2013 | $683 | $18,960 | $2,890 | $16,070 |
Property History
| Date | Event | Price | List to Sale | Price per Sq Ft |
|---|---|---|---|---|
| 11/27/2025 11/27/25 | Price Changed | $154,900 | -6.1% | $121 / Sq Ft |
| 10/16/2025 10/16/25 | Price Changed | $164,900 | -2.9% | $128 / Sq Ft |
| 08/11/2025 08/11/25 | For Sale | $169,900 | 0.0% | $132 / Sq Ft |
| 08/08/2025 08/08/25 | Pending | -- | -- | -- |
| 06/24/2025 06/24/25 | Price Changed | $169,900 | -3.4% | $132 / Sq Ft |
| 06/01/2025 06/01/25 | For Sale | $175,900 | -- | $137 / Sq Ft |
Purchase History
| Date | Type | Sale Price | Title Company |
|---|---|---|---|
| Quit Claim Deed | -- | None Listed On Document | |
| Quit Claim Deed | -- | None Listed On Document | |
| Warranty Deed | -- | Attorney | |
| Warranty Deed | -- | -- | |
| Deed | $30,000 | Lakeside Title & Escrow Agen | |
| Sheriffs Deed | $48,000 | -- | |
| Deed | $47,000 | -- |
Mortgage History
| Date | Status | Loan Amount | Loan Type |
|---|---|---|---|
| Previous Owner | $47,400 | FHA |
Source: MLS of Greater Cincinnati (CincyMLS)
MLS Number: 1842972
APN: 15-025520-0000
Disclaimer: Certain information contained herein is derived from information provided by parties other than Homes.com. All information provided is deemed reliable, but is not guaranteed to be accurate and should be independently verified.
![]() The data relating to real estate for sale on this website comes in part from the Broker Reciprocity programs of the MLS of Greater Cincinnati, Inc.. Those listings held by brokerage firms other than Ten-X are marked with the Broker Reciprocity logo and house icon. The properties displayed may not be all of the properties available through Broker Reciprocity.
The data relating to real estate for sale on this website comes in part from the Broker Reciprocity programs of the MLS of Greater Cincinnati, Inc.. Those listings held by brokerage firms other than Ten-X are marked with the Broker Reciprocity logo and house icon. The properties displayed may not be all of the properties available through Broker Reciprocity.
IDX information is provided exclusively for personal, non-commercial use, and may not be used for any purpose other than to identify prospective properties consumers may be interested in purchasing.
Information is deemed reliable but not guaranteed.
Ten-X does not display the entire Cincinnati MLS Broker Reciprocity™ database on this web site. The listings of some real estate brokerage firms have been excluded.
Copyright 2025, MLS of Greater Cincinnati, Inc. All rights reserved
- 1730 Braeburn Rd
- 0 U S Route 52
- 1630 Friendship Rd
- 265 Barbour Dr
- 1601 Friendship Rd
- 178 Bradford Ln
- 1888 Stivers Rd
- 8170 Us Rt 52
- Lot Stivers
- 8503 Stringtown Rd
- 1189 Pennsylvania St
- 941 Jersey Ridge Rd
- 464 W 2nd St
- 449 W 2nd St
- 448 W 2nd St
- 450 W 2nd St
- 0 Jersey Ridge Rd
- 8104 Stringtown Rd
- 320 W 2nd St
- 9076 St Rt 41
- 1890 Vista Cir
- 1960 Justin Way
- 208 Sutton St Unit 3
- 512 Florence St
- 507 W 6th St
- 610 Markley Ave
- 401 Marshall Ave
- 679 S Main St
- 104 S Pleasant St Unit 2
- 1021 Unity Rd
- 135 Candlelight Way
- 319 Pleasant St
- 671 Shaker Run Rd
- 2029 River Birch Dr
- 2058 River Birch Dr
- 1510 Redridge Dr
- 1762 Culver Ct
- 20 Belwood Ct
- 3 Bobwhite Ct
- 17 Woodside Park Dr
