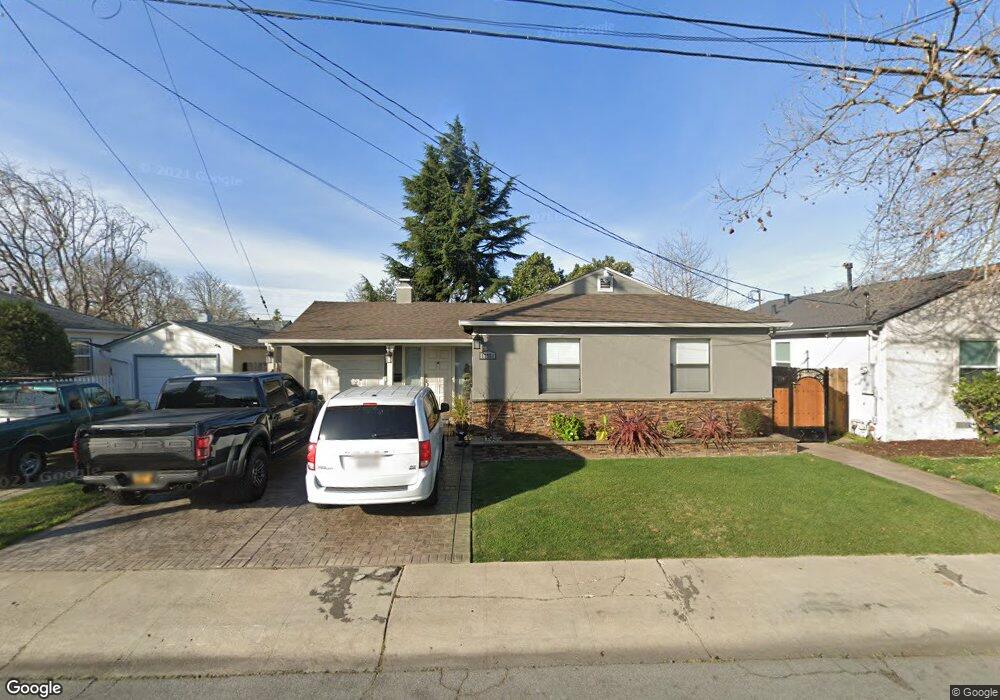
17551 Via Primero San Lorenzo, CA 94580
Estimated Value: $748,000 - $847,000
3
Beds
1
Bath
1,000
Sq Ft
$790/Sq Ft
Est. Value
About This Home
This home is located at 17551 Via Primero, San Lorenzo, CA 94580 and is currently estimated at $789,809, approximately $789 per square foot. 17551 Via Primero is a home located in Alameda County with nearby schools including Lorenzo Manor Elementary School, Bohannon Middle School, and San Lorenzo High School.
Ownership History
Date
Name
Owned For
Owner Type
Purchase Details
Closed on
Aug 11, 2015
Sold by
Rangel Mayra
Bought by
Rangel Omar
Current Estimated Value
Home Financials for this Owner
Home Financials are based on the most recent Mortgage that was taken out on this home.
Original Mortgage
$468,813
Interest Rate
4.4%
Mortgage Type
FHA
Purchase Details
Closed on
Jun 16, 2015
Sold by
Clements Thomas J and Clements Catherine E
Bought by
Rangel Omar
Home Financials for this Owner
Home Financials are based on the most recent Mortgage that was taken out on this home.
Original Mortgage
$468,813
Interest Rate
4.4%
Mortgage Type
FHA
Purchase Details
Closed on
Mar 3, 2014
Sold by
Aviles Juan and Aviles Aida
Bought by
Clements Thomas J and Clements Catherine E
Create a Home Valuation Report for This Property
The Home Valuation Report is an in-depth analysis detailing your home's value as well as a comparison with similar homes in the area
Home Values in the Area
Average Home Value in this Area
Purchase History
| Date | Buyer | Sale Price | Title Company |
|---|---|---|---|
| Rangel Omar | -- | North American Title Co Inc | |
| Rangel Omar | $485,000 | North American Title Co Inc | |
| Clements Thomas J | $250,000 | North American Title Co Inc |
Source: Public Records
Mortgage History
| Date | Status | Borrower | Loan Amount |
|---|---|---|---|
| Previous Owner | Rangel Omar | $468,813 |
Source: Public Records
Tax History Compared to Growth
Tax History
| Year | Tax Paid | Tax Assessment Tax Assessment Total Assessment is a certain percentage of the fair market value that is determined by local assessors to be the total taxable value of land and additions on the property. | Land | Improvement |
|---|---|---|---|---|
| 2025 | $7,395 | $567,127 | $172,238 | $401,889 |
| 2024 | $7,395 | $555,871 | $168,861 | $394,010 |
| 2023 | $7,357 | $551,837 | $165,551 | $386,286 |
| 2022 | $7,249 | $534,017 | $162,305 | $378,712 |
| 2021 | $7,050 | $523,410 | $159,123 | $371,287 |
| 2020 | $6,900 | $524,973 | $157,492 | $367,481 |
| 2019 | $6,910 | $514,681 | $154,404 | $360,277 |
| 2018 | $6,536 | $504,593 | $151,378 | $353,215 |
| 2017 | $6,236 | $494,700 | $148,410 | $346,290 |
| 2016 | $5,950 | $485,000 | $145,500 | $339,500 |
| 2015 | $5,113 | $407,991 | $122,397 | $285,594 |
| 2014 | $3,267 | $243,809 | $73,256 | $170,553 |
Source: Public Records
Map
Nearby Homes
- 17761 Via Arriba
- 17347 Via Encinas
- 17316 Via Flores
- 819 Bockman Rd
- 15958 Via Descanso
- 19461 Royal Ave
- 334 Oxford St
- 18251 Via Jose
- 19665 Royal Ave
- 15867 Hesperian Blvd
- 19150 Hesperian Blvd Unit 19
- 16011 Via Conejo
- 17779 Rainier Ave
- 769 Bartlett Ave
- 16050 Via Olinda
- 18018 Sahara Rd
- 18003 Incline Place
- 17754 Meekland Ave Unit 1
- 18005 Sunol Rd
- 19539 Meekland Ave
- 17525 Via Primero
- 17579 Via Primero
- 423 Via Coches
- 17366 Via Andeta
- 17469 Via Primero
- 17336 Via Andeta
- 17402 Via Andeta
- 17306 Via Andeta
- 17552 Via Primero
- 17578 Via Primero
- 17441 Via Primero
- 17526 Via Primero
- 17468 Via Primero
- 17282 Via Andeta
- 17367 Via Primero
- 414 Via Coches
- 424 Via Coches
- 17440 Via Primero
- 404 Via Coches
- 379 Via Coches