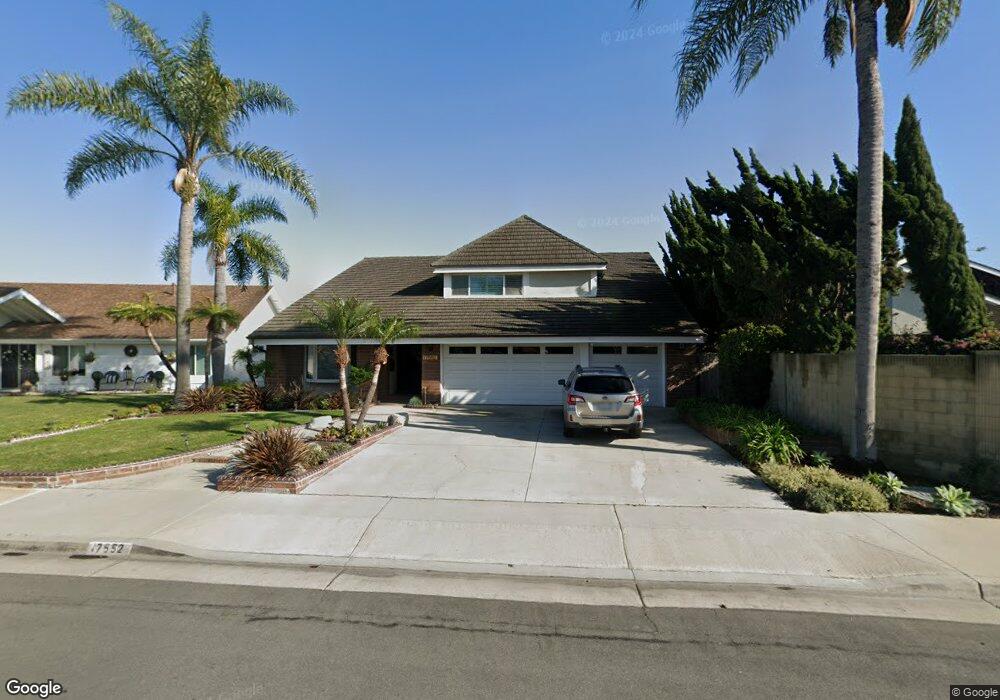
17552 Woodfern Ln Huntington Beach, CA 92649
Estimated Value: $1,581,615 - $1,901,000
4
Beds
3
Baths
2,031
Sq Ft
$826/Sq Ft
Est. Value
About This Home
This home is located at 17552 Woodfern Ln, Huntington Beach, CA 92649 and is currently estimated at $1,678,154, approximately $826 per square foot. 17552 Woodfern Ln is a home located in Orange County with nearby schools including Hope View Elementary School, Marine View Middle, and Huntington Beach High School.
Ownership History
Date
Name
Owned For
Owner Type
Purchase Details
Closed on
Jul 2, 2025
Sold by
Ward Cory D and Ward Karen D
Bought by
Ward Family Trust and Ward
Current Estimated Value
Purchase Details
Closed on
Jul 22, 1999
Sold by
Michael Jay and Michael Mary
Bought by
Ward Cory D and Ward Karen D
Home Financials for this Owner
Home Financials are based on the most recent Mortgage that was taken out on this home.
Original Mortgage
$381,200
Interest Rate
7.63%
Purchase Details
Closed on
Jul 29, 1994
Sold by
Munson Arthur L and Munson Linda L
Bought by
Jay Michael H and Jay Mary A
Home Financials for this Owner
Home Financials are based on the most recent Mortgage that was taken out on this home.
Original Mortgage
$288,000
Interest Rate
5.75%
Create a Home Valuation Report for This Property
The Home Valuation Report is an in-depth analysis detailing your home's value as well as a comparison with similar homes in the area
Home Values in the Area
Average Home Value in this Area
Purchase History
| Date | Buyer | Sale Price | Title Company |
|---|---|---|---|
| Ward Family Trust | -- | None Listed On Document | |
| Ward Cory D | $476,500 | Fidelity National Title Ins | |
| Jay Michael H | $360,000 | Gateway Title Company |
Source: Public Records
Mortgage History
| Date | Status | Borrower | Loan Amount |
|---|---|---|---|
| Previous Owner | Ward Cory D | $381,200 | |
| Previous Owner | Jay Michael H | $288,000 | |
| Closed | Ward Cory D | $47,650 |
Source: Public Records
Tax History Compared to Growth
Tax History
| Year | Tax Paid | Tax Assessment Tax Assessment Total Assessment is a certain percentage of the fair market value that is determined by local assessors to be the total taxable value of land and additions on the property. | Land | Improvement |
|---|---|---|---|---|
| 2025 | $8,170 | $731,596 | $549,496 | $182,100 |
| 2024 | $8,170 | $717,251 | $538,721 | $178,530 |
| 2023 | $7,985 | $703,188 | $528,158 | $175,030 |
| 2022 | $7,867 | $689,400 | $517,801 | $171,599 |
| 2021 | $7,722 | $675,883 | $507,648 | $168,235 |
| 2020 | $7,635 | $668,953 | $502,443 | $166,510 |
| 2019 | $7,501 | $655,837 | $492,591 | $163,246 |
| 2018 | $7,331 | $642,978 | $482,932 | $160,046 |
| 2017 | $7,213 | $630,371 | $473,463 | $156,908 |
| 2016 | $6,915 | $618,011 | $464,179 | $153,832 |
| 2015 | $6,809 | $608,728 | $457,206 | $151,522 |
| 2014 | $6,674 | $596,804 | $448,250 | $148,554 |
Source: Public Records
Map
Nearby Homes
- 5812 Raphael Dr
- 5862 Raphael Dr
- 17982 Whitford Ln
- 17301 Juniper Ln
- 5262 Glenroy Dr
- 17042 Twain Ln
- 5241 Glenroy Dr
- 17202 Corbina Ln Unit 108
- 17442 Coronado Ln
- 6171 Kiser Dr
- 17191 Corbina Ln Unit 110
- 6012 Jasonwood Dr
- 6051 Summerdale Dr
- 17071 Pinehurst Ln
- 5031 202 Dorado
- 17231 Lido Ln
- 18202 Foss Ln
- 17472 Oakbluffs Ln
- 17291 Wareham Ln
- 17272 Tidalridge Ln
- 17542 Woodfern Ln
- 5611 Serene Dr
- 5621 Serene Dr
- 5631 Serene Dr
- 17532 Woodfern Ln
- 17551 Berlark Cir
- 17541 Berlark Cir
- 17571 Berlark Cir
- 5602 Mossvale Cir
- 5591 Serene Dr
- 17531 Berlark Cir
- 17522 Woodfern Ln
- 17581 Berlark Cir
- 17521 Berlark Cir
- 5592 Mossvale Cir
- 5612 Serene Dr
- 5581 Serene Dr
- 5622 Serene Dr
- 17502 Woodfern Ln
- 5602 Serene Dr