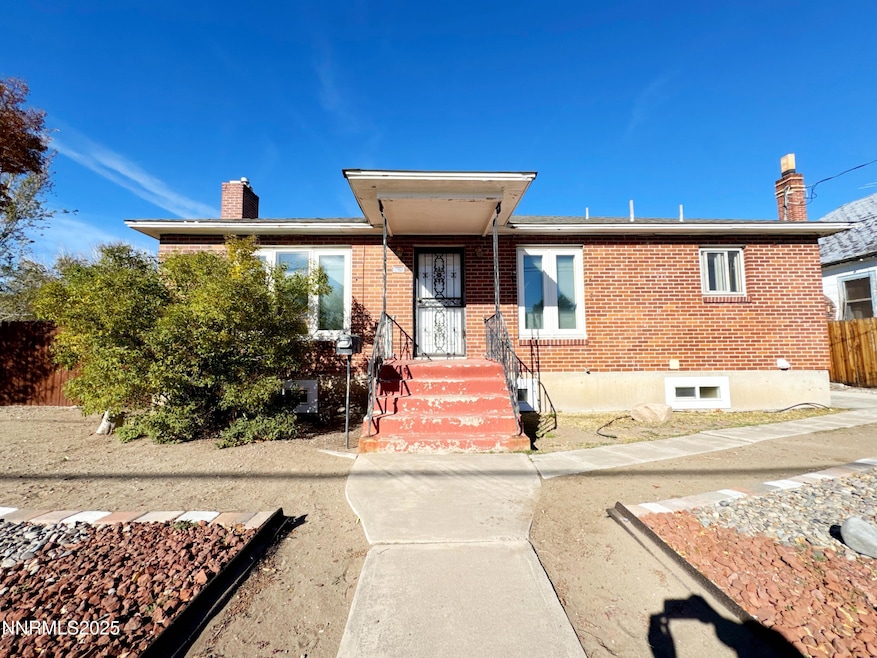
1756 I St Sparks, NV 89431
Downtown Sparks NeighborhoodEstimated payment $2,161/month
Highlights
- RV Access or Parking
- Covered Deck
- Separate Formal Living Room
- City View
- Wood Flooring
- Great Room
About This Home
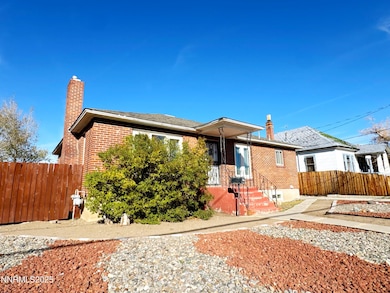
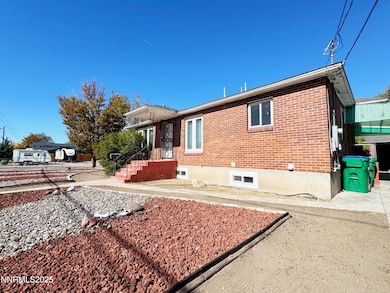
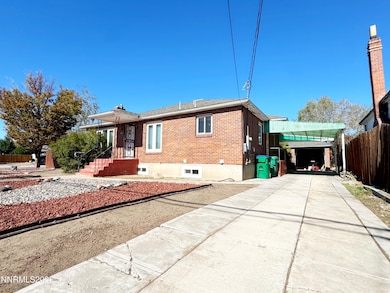
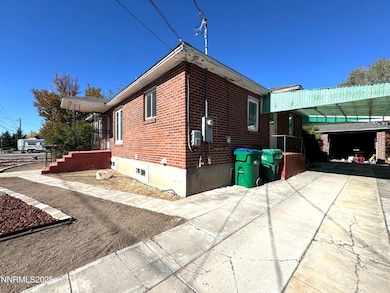
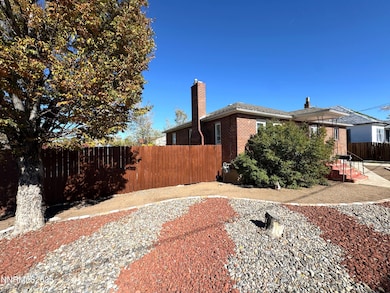
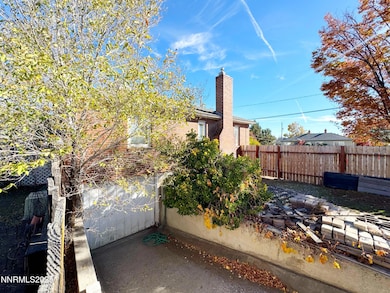
A truly unique Sparks home with character and potential! This 2 bed, 2 bath property sits on a spacious corner lot with RV access, detached and attached garages and low-maintenance xeriscaping. Zoned Mixed-Use for flexible future use! Enjoy high quality triple pane windows, no HOA and a great layout with an updated finished basement that blends classic charm with opportunity for personalization offering flexible living space ideal for a primary suite, guest area, or bonus room. Perfect buyers or investors looking for value and versatility in a growing area. Schedule your showing today!
Home Details
Home Type
- Single Family
Est. Annual Taxes
- $942
Year Built
- Built in 1952
Lot Details
- 9,017 Sq Ft Lot
- Dog Run
- Back Yard Fenced
- Level Lot
- Property is zoned MUD
Parking
- 2 Car Garage
- 1 Carport Space
- Additional Parking
- RV Access or Parking
Property Views
- City
- Mountain
Home Design
- Brick Veneer
- Frame Construction
- Shingle Roof
- Composition Roof
- Stick Built Home
Interior Spaces
- 1,353 Sq Ft Home
- 1-Story Property
- Ceiling Fan
- Wood Burning Fireplace
- Triple Pane Windows
- Blinds
- Family Room with Fireplace
- Great Room
- Separate Formal Living Room
- Game Room
- Finished Basement
- Crawl Space
Kitchen
- Breakfast Area or Nook
- Breakfast Bar
- Built-In Oven
- Electric Cooktop
- Microwave
- Dishwasher
- Disposal
Flooring
- Wood
- Carpet
Bedrooms and Bathrooms
- 2 Bedrooms
- In-Law or Guest Suite
- 2 Full Bathrooms
Laundry
- Dryer
- Washer
Home Security
- Carbon Monoxide Detectors
- Fire and Smoke Detector
Accessible Home Design
- Level Entry For Accessibility
Outdoor Features
- Covered Deck
- Shed
- Storage Shed
- Outbuilding
Schools
- Smith Elementary School
- Sparks Middle School
- Sparks High School
Utilities
- Refrigerated and Evaporative Cooling System
- Forced Air Heating System
- Heating System Uses Natural Gas
- Natural Gas Connected
- Electric Water Heater
- Internet Available
- Phone Available
- Cable TV Available
Community Details
- No Home Owners Association
- Sparks Community
- Newtown Tract Subdivision
- The community has rules related to covenants, conditions, and restrictions
Listing and Financial Details
- Assessor Parcel Number 031-191-06
Map
Home Values in the Area
Average Home Value in this Area
Tax History
| Year | Tax Paid | Tax Assessment Tax Assessment Total Assessment is a certain percentage of the fair market value that is determined by local assessors to be the total taxable value of land and additions on the property. | Land | Improvement |
|---|---|---|---|---|
| 2025 | $942 | $60,444 | $31,675 | $28,769 |
| 2024 | $915 | $56,225 | $27,860 | $28,365 |
| 2023 | $915 | $56,767 | $30,625 | $26,142 |
| 2022 | $889 | $43,980 | $22,680 | $21,300 |
| 2021 | $863 | $37,093 | $16,275 | $20,818 |
| 2020 | $837 | $36,351 | $15,820 | $20,531 |
| 2019 | $812 | $33,086 | $13,615 | $19,471 |
| 2018 | $766 | $28,292 | $10,220 | $18,072 |
| 2017 | $744 | $27,313 | $9,555 | $17,758 |
| 2016 | $725 | $25,002 | $7,420 | $17,582 |
| 2015 | $724 | $23,232 | $5,775 | $17,457 |
| 2014 | $703 | $20,414 | $3,815 | $16,599 |
| 2013 | -- | $18,783 | $2,730 | $16,053 |
Property History
| Date | Event | Price | List to Sale | Price per Sq Ft |
|---|---|---|---|---|
| 11/07/2025 11/07/25 | For Sale | $395,000 | -- | $292 / Sq Ft |
Purchase History
| Date | Type | Sale Price | Title Company |
|---|---|---|---|
| Bargain Sale Deed | $105,500 | Stewart Title Of Nevada Reno | |
| Trustee Deed | $209,446 | Accommodation |
Mortgage History
| Date | Status | Loan Amount | Loan Type |
|---|---|---|---|
| Open | $50,000 | New Conventional |
Source: Northern Nevada Regional MLS
MLS Number: 250057984
APN: 031-191-06
Disclaimer: Certain information contained herein is derived from information provided by parties other than Homes.com. All information provided is deemed reliable, but is not guaranteed to be accurate and should be independently verified.
![]() IDX information is provided exclusively for personal, non-commercial use, and may not be used for any purpose other than to identify prospective properties consumers may be interested in purchasing. Information is deemed reliable but not guaranteed. The content relating to real estate for sale on this web site comes in part from the Broker Reciprocity/ IDX program of the Northern Nevada Regional Multiple Listing Service°. Real estate listings held by brokerage firms other than Ten-X are marked with the Broker Reciprocity logo and detailed information about those listings includes the name of the listing brokerage. Any use of the content other than by a search performed by a consumer looking to purchase or rent real estate is prohibited. © 2025 Northern Nevada Regional Multiple Listing Service® MLS. All rights reserved.
IDX information is provided exclusively for personal, non-commercial use, and may not be used for any purpose other than to identify prospective properties consumers may be interested in purchasing. Information is deemed reliable but not guaranteed. The content relating to real estate for sale on this web site comes in part from the Broker Reciprocity/ IDX program of the Northern Nevada Regional Multiple Listing Service°. Real estate listings held by brokerage firms other than Ten-X are marked with the Broker Reciprocity logo and detailed information about those listings includes the name of the listing brokerage. Any use of the content other than by a search performed by a consumer looking to purchase or rent real estate is prohibited. © 2025 Northern Nevada Regional Multiple Listing Service® MLS. All rights reserved.
- 848 Rock Blvd
- 1720 G St
- 1841 Merchant St
- 1889 Merchant St
- 1560 Steven Ct Unit 2
- 2011 H St
- 973 Damon Ln
- 1536 Irene Way
- 1527 Steven Ct
- 1855 Verano Dr
- 2002 F St
- 2168 Cannonball Rd
- 2136 Roundhouse Rd
- 1830 C St
- 1780 Greenbrae Dr
- 2385 Pauline Ave
- 1365 Prospect Ave
- 1010 12th St
- 1229 & 1231 F St
- 2380 Roundhouse Rd
- 1600 I St Unit 2104
- 1600 I St Unit 1305
- 1600 I St Unit 1306
- 1080-1098 Rock Blvd
- 1607 H St Unit 1/2
- 1835 Oddie Blvd
- 1539 G St Unit C
- 1260 Commerce St
- 1100 15th St
- 314 Rock Blvd
- 240 18th St
- 238 18th St
- 236 18th St
- 1837 C St
- 2147 Roundhouse Rd
- 1695 Trabert Way
- 1726 A St
- 2280 Oddie Blvd
- 1400 Avenue of The Oaks
- 1800 Sullivan Ln
