Estimated Value: $369,000 - $501,000
3
Beds
2
Baths
1,815
Sq Ft
$247/Sq Ft
Est. Value
About This Home
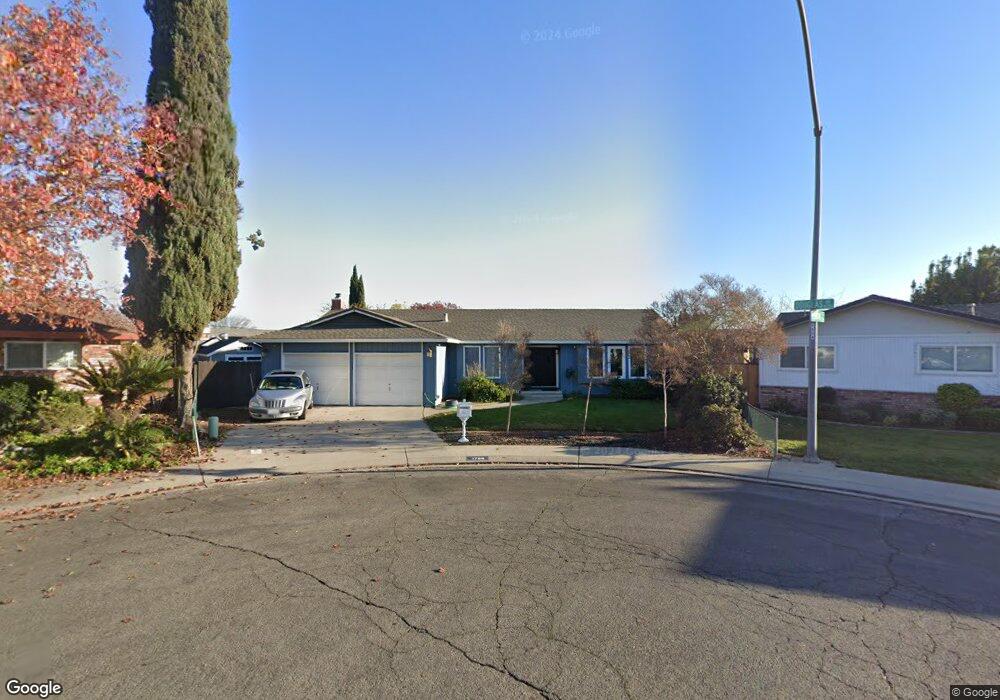
This home is located at 1756 Running Ln, Ceres, CA 95307 and is currently estimated at $448,942, approximately $247 per square foot. 1756 Running Ln is a home located in Stanislaus County with nearby schools including Carroll Fowler Elementary School, Mae Hensley Junior High School, and Ceres High School.
Ownership History
Date
Name
Owned For
Owner Type
Purchase Details
Closed on
Mar 8, 2011
Sold by
Miceli Peter Joseph and Miceli Tanya Elaine
Bought by
Miceli Tanya Elaine
Current Estimated Value
Purchase Details
Closed on
Sep 18, 1997
Sold by
Steele Ray J and Steele Helen L
Bought by
Miceli Peter Joseph and Miceli Tanya Elaine
Home Financials for this Owner
Home Financials are based on the most recent Mortgage that was taken out on this home.
Original Mortgage
$115,184
Interest Rate
7.36%
Mortgage Type
FHA
Purchase Details
Closed on
Feb 16, 1995
Sold by
Steele Ray J and Steele Helen L
Bought by
Steele Ray J and Steele Helen L
Home Financials for this Owner
Home Financials are based on the most recent Mortgage that was taken out on this home.
Original Mortgage
$45,000
Interest Rate
8.9%
Create a Home Valuation Report for This Property
The Home Valuation Report is an in-depth analysis detailing your home's value as well as a comparison with similar homes in the area
Purchase History
| Date | Buyer | Sale Price | Title Company |
|---|---|---|---|
| Miceli Tanya Elaine | -- | None Available | |
| Miceli Peter Joseph | $116,000 | Chicago Title Co | |
| Steele Ray J | -- | Fidelity National Title |
Source: Public Records
Mortgage History
| Date | Status | Borrower | Loan Amount |
|---|---|---|---|
| Previous Owner | Miceli Peter Joseph | $115,184 | |
| Previous Owner | Steele Ray J | $45,000 |
Source: Public Records
Tax History
| Year | Tax Paid | Tax Assessment Tax Assessment Total Assessment is a certain percentage of the fair market value that is determined by local assessors to be the total taxable value of land and additions on the property. | Land | Improvement |
|---|---|---|---|---|
| 2025 | $2,089 | $185,206 | $52,683 | $132,523 |
| 2024 | $1,956 | $181,575 | $51,650 | $129,925 |
| 2023 | $1,902 | $178,016 | $50,638 | $127,378 |
| 2022 | $1,885 | $174,527 | $49,646 | $124,881 |
| 2021 | $1,866 | $171,106 | $48,673 | $122,433 |
| 2020 | $1,807 | $169,352 | $48,174 | $121,178 |
| 2019 | $1,794 | $166,032 | $47,230 | $118,802 |
| 2018 | $1,756 | $162,777 | $46,304 | $116,473 |
| 2017 | $1,741 | $159,587 | $45,397 | $114,190 |
| 2016 | $1,704 | $156,458 | $44,507 | $111,951 |
| 2015 | $1,680 | $154,109 | $43,839 | $110,270 |
| 2014 | $1,644 | $151,091 | $42,981 | $108,110 |
Source: Public Records
Map
Nearby Homes
- 1655 Moffett Rd
- 1647 Moffett Rd
- 1645 Moffett Rd
- 2644 Parkway
- 2409 Lavon Ln
- 2605 Glasgow Dr
- 1805 Myrtlewood Dr
- 1415 Villa Way
- 1409 Villa Way
- 1821 Rose Ave
- 2511 E Hatch Rd
- 2509 E Hatch Rd
- 1821 Myrtlewood Dr
- 0 5th St
- 2841 Fowler Rd Unit 33
- 1713 Pikake Ct
- 2845 E Hatch Rd Unit 78
- 2845 E Hatch Rd Unit 86
- 2845 E Hatch Rd Unit 84
- 2313 Thomas St
- 2512 Douglas Dr
- 1752 Running Ln
- 1757 Moffett Rd
- 2517 Mauna Kea Dr
- 2513 Mauna Kea Dr
- 1753 Moffett Rd
- 1755 Moffett Rd
- 2521 Mauna Kea Dr
- 2508 Douglas Dr
- 1748 Running Ln
- 2509 Mauna Kea Dr
- 1749 Moffett Rd
- 2513 Douglas Dr
- 1700 Moffett Rd
- 2504 Douglas Dr
- 1744 Running Ln
- 2516 Mauna Kea Dr
- 2505 Mauna Kea Dr
- 2608 Parkway
- 2520 Calcagno St
Your Personal Tour Guide
Ask me questions while you tour the home.