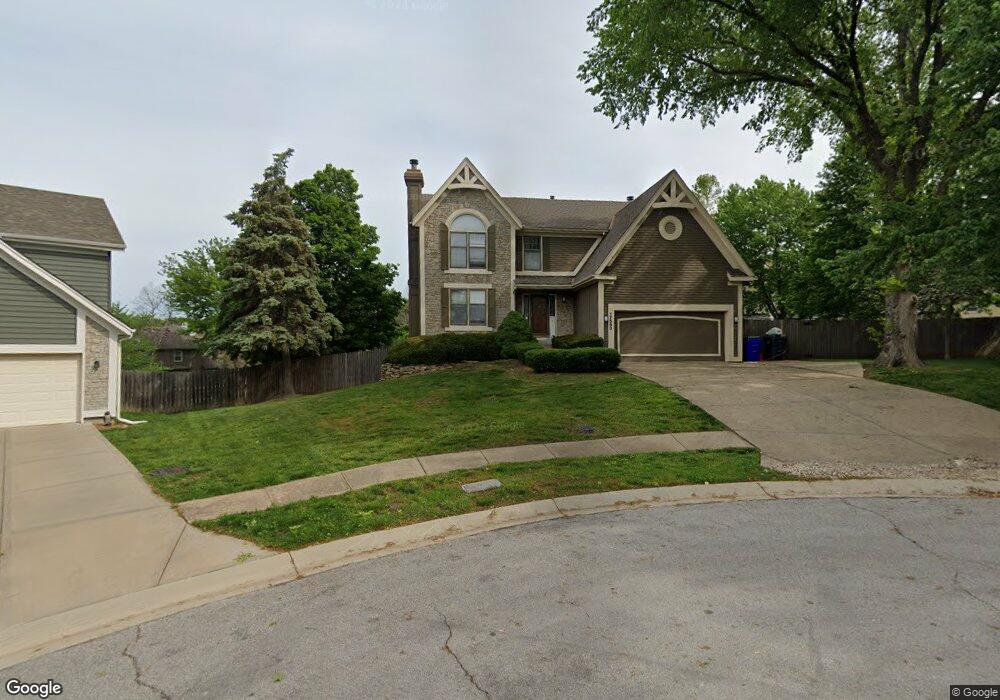
17560 W 113th St Olathe, KS 66061
Estimated Value: $450,000 - $453,000
4
Beds
4
Baths
2,439
Sq Ft
$185/Sq Ft
Est. Value
About This Home
This home is located at 17560 W 113th St, Olathe, KS 66061 and is currently estimated at $451,159, approximately $184 per square foot. 17560 W 113th St is a home located in Johnson County with nearby schools including Woodland Elementary School, Santa Fe Trail Middle School, and Olathe North Sr High School.
Ownership History
Date
Name
Owned For
Owner Type
Purchase Details
Closed on
Nov 8, 2011
Sold by
Cheng Wai Chu and Liu Xiaoyu
Bought by
Liu Xiaoyu
Current Estimated Value
Home Financials for this Owner
Home Financials are based on the most recent Mortgage that was taken out on this home.
Original Mortgage
$110,000
Outstanding Balance
$70,726
Interest Rate
2.87%
Mortgage Type
New Conventional
Estimated Equity
$380,433
Purchase Details
Closed on
Feb 4, 2010
Sold by
Cheng Wai Chu and Liu Xiaoyu
Bought by
Cheng Wai Chu and Liu Xiaoyu
Purchase Details
Closed on
Mar 21, 2002
Sold by
Garrett Karen Lee and Fulton Karen G
Bought by
Cheng Wai Chu and Liu Xiaoyu
Home Financials for this Owner
Home Financials are based on the most recent Mortgage that was taken out on this home.
Original Mortgage
$152,400
Interest Rate
6.87%
Create a Home Valuation Report for This Property
The Home Valuation Report is an in-depth analysis detailing your home's value as well as a comparison with similar homes in the area
Home Values in the Area
Average Home Value in this Area
Purchase History
| Date | Buyer | Sale Price | Title Company |
|---|---|---|---|
| Liu Xiaoyu | -- | Chicago Title Company Llc | |
| Cheng Wai Chu | -- | None Available | |
| Cheng Wai Chu | -- | Security Land Title Company |
Source: Public Records
Mortgage History
| Date | Status | Borrower | Loan Amount |
|---|---|---|---|
| Open | Liu Xiaoyu | $110,000 | |
| Closed | Cheng Wai Chu | $152,400 |
Source: Public Records
Tax History Compared to Growth
Tax History
| Year | Tax Paid | Tax Assessment Tax Assessment Total Assessment is a certain percentage of the fair market value that is determined by local assessors to be the total taxable value of land and additions on the property. | Land | Improvement |
|---|---|---|---|---|
| 2024 | $5,160 | $45,793 | $8,484 | $37,309 |
| 2023 | $5,224 | $45,471 | $7,704 | $37,767 |
| 2022 | $4,080 | $34,672 | $6,419 | $28,253 |
| 2021 | $4,080 | $32,154 | $6,419 | $25,735 |
| 2020 | $4,015 | $32,189 | $5,586 | $26,603 |
| 2019 | $3,957 | $31,464 | $5,586 | $25,878 |
| 2018 | $6,640 | $31,257 | $5,069 | $26,188 |
| 2017 | $3,829 | $29,969 | $5,069 | $24,900 |
| 2016 | $3,334 | $26,795 | $4,400 | $22,395 |
| 2015 | $3,181 | $25,588 | $4,400 | $21,188 |
| 2013 | -- | $24,392 | $3,994 | $20,398 |
Source: Public Records
Map
Nearby Homes
- 17605 W 113th Terrace
- 17611 W 111th Terrace
- 11548 S Lennox St
- 11602 S Lennox Cir
- 11585 S Bell Court Dr Unit 103
- 19564 W 114th St
- 18380 W 116th St
- No Address W 119th St
- 976 E 120th St
- 968 E 120th St
- 960 E 120th St
- 952 E 120th St
- 944 E 120th St
- 936 E 120th St
- 928 E 120th St
- 920 E 120th St
- 912 E 120th St
- 904 E 120th St
- 18966 W 117th Terrace
- 19257 W 114th Terrace
- 17570 W 113th St
- 17583 W 112th St
- 17585 W 112th St
- 17569 W 112th St
- 17550 W 113th St
- 17587 W 112th St
- 11225 S Penrose St
- 17580 W 113th St
- 17567 W 112th St
- 11265 S Penrose St
- 17540 W 113th St
- 17589 W 112th St
- 17555 W 112th St
- 17590 W 113th St
- 17530 W 113th St
- 17600 W 113th St
- 17553 W 112th St
- 17578 W 112th St
- 17574 W 112th St
- 17582 W 112th St