17561 Redding St Hesperia, CA 92345
The Mesa NeighborhoodEstimated Value: $392,000 - $428,000
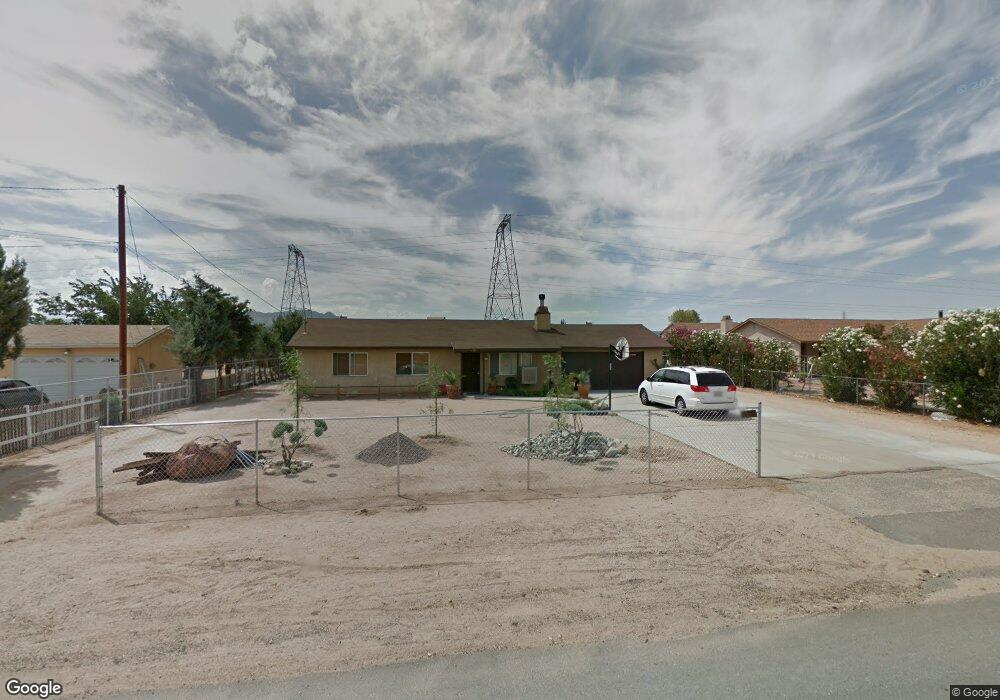
About This Home
This home is located at 17561 Redding St, Hesperia, CA 92345 and is currently estimated at $409,576, approximately $320 per square foot. 17561 Redding St is a home located in San Bernardino County with nearby schools including Kingston Elementary School, Ranchero Middle School, and Sultana High School.
Ownership History
We collect this data history from publicly available records. To have your information removed, we recommend requesting removal directly through your county’s website.
Purchase Details
Purchase Details
Home Financials for this Owner
Home Financials are based on the most recent Mortgage that was taken out on this home.Purchase Details
Home Values in the Area
Average Home Value in this Area
Purchase History
We collect this data history from publicly available records. To have your information removed, we recommend requesting removal directly through your county’s website.
| Date | Buyer | Sale Price | Title Company |
|---|---|---|---|
| $13,000 | Advantage Title | ||
| -- | Commonwealth Land Title Co | ||
| $73,000 | Commonwealth Land Title Co |
Mortgage History
We collect this data history from publicly available records. To have your information removed, we recommend requesting removal directly through your county’s website.
| Date | Status | Borrower | Loan Amount |
|---|---|---|---|
| Previous Owner | $102,000 |
Tax History
We collect this data history from publicly available records. To have your information removed, we recommend requesting removal directly through your county’s website.
| Year | Tax Paid | Tax Assessment Tax Assessment Total Assessment is a certain percentage of the fair market value that is determined by local assessors to be the total taxable value of land and additions on the property. | Land | Improvement |
|---|---|---|---|---|
| 2025 | $1,267 | $115,304 | $31,132 | $84,172 |
| 2024 | $1,238 | $113,044 | $30,522 | $82,522 |
| 2023 | $1,223 | $110,828 | $29,924 | $80,904 |
| 2022 | $1,195 | $108,655 | $29,337 | $79,318 |
| 2021 | $1,172 | $106,525 | $28,762 | $77,763 |
| 2020 | $1,158 | $105,433 | $28,467 | $76,966 |
| 2019 | $1,134 | $103,366 | $27,909 | $75,457 |
| 2018 | $1,111 | $101,339 | $27,362 | $73,977 |
| 2017 | $1,091 | $99,351 | $26,825 | $72,526 |
| 2016 | $1,067 | $97,403 | $26,299 | $71,104 |
| 2015 | -- | $95,940 | $25,904 | $70,036 |
| 2014 | $1,110 | $94,061 | $25,397 | $68,664 |
Map
- 7653 Montrose Ave
- 7623 Oxford Ave
- 7602 Newhall Ave
- 8055 Newhall Ave
- 7602 Montrose Ave
- 0 Oxford Ave Unit HD26132902
- 17930 Seaforth St
- 7648 Jenkins Ave
- 8167 Windsor Ave
- 7454 Lyons Ave
- 17995 Seaforth St
- 10 AC Paisley Ave
- 18132 Bangor Ave
- 16 Bangor Ave
- 7625 Windsor Ave
- 7574 Hastings Ave
- 7371 Lyons Ave
- 7589 Glider Ave
- 7829 Chase Ave
- 7344 Oxford Ave
- 17547 Redding St
- 17575 Redding St
- 7876 I Ave
- 17531 Redding St
- 7867 Oxford Ave
- 17582 Redding St
- 17515 Redding St
- 7883 Oxford Ave
- 7898 I Ave
- 7868 Oxford Ave
- 7847 I Ave
- 17497 Redding St
- 7897 Oxford Ave
- 7910 I Ave
- 17580 Seaforth St
- 17564 Seaforth St
- 17590 Seaforth St
- 7884 Oxford Ave
- 7885 I Ave
- 17598 Seaforth St
Ask me questions while you tour the home.