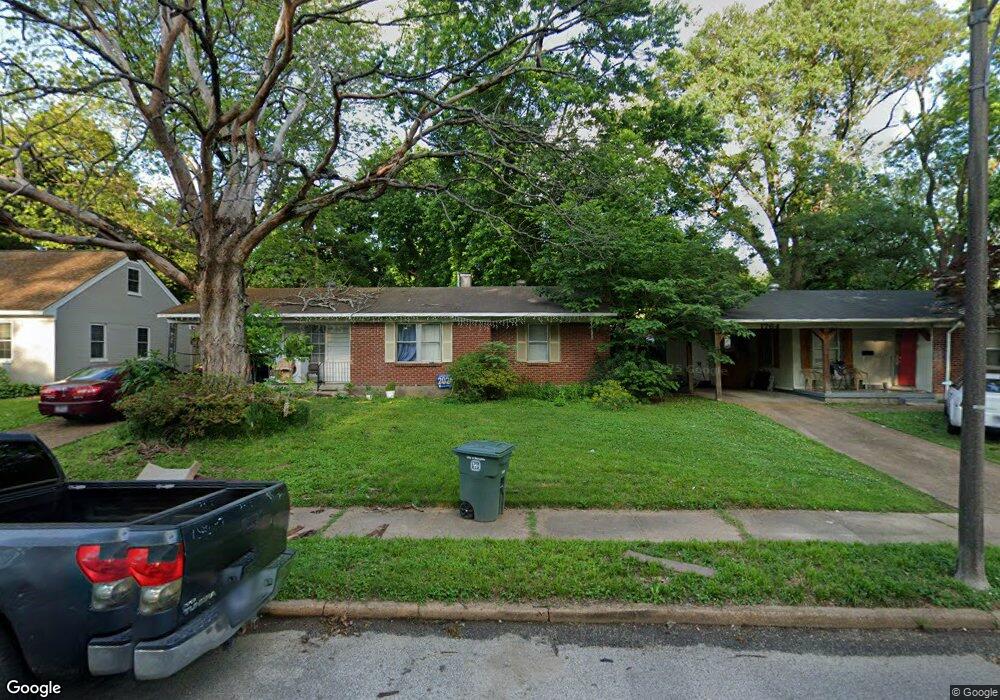
1758 Capri St Memphis, TN 38117
Colonial Acres NeighborhoodEstimated Value: $106,000 - $126,445
3
Beds
1
Bath
931
Sq Ft
$125/Sq Ft
Est. Value
About This Home
This home is located at 1758 Capri St, Memphis, TN 38117 and is currently estimated at $116,361, approximately $124 per square foot. 1758 Capri St is a home located in Shelby County with nearby schools including Willow Oaks Elementary School, Colonial Middle, and Overton High.
Ownership History
Date
Name
Owned For
Owner Type
Purchase Details
Closed on
Jul 21, 2009
Sold by
Fannie Mae
Bought by
Jones Hermon C
Current Estimated Value
Purchase Details
Closed on
May 11, 2009
Sold by
Vowell Stewart
Bought by
Federal National Mortgage Association
Purchase Details
Closed on
May 22, 2003
Sold by
Bloomfield Dana Lynn and Bloomfield Stuart
Bought by
Hud
Purchase Details
Closed on
Nov 30, 2000
Sold by
Sneed Sneed Richard P R
Bought by
Bloomfield Stuart and Bloomfield Dana Lynn
Home Financials for this Owner
Home Financials are based on the most recent Mortgage that was taken out on this home.
Original Mortgage
$68,336
Interest Rate
7.79%
Mortgage Type
FHA
Purchase Details
Closed on
Jun 30, 1997
Bought by
Sneed Richard P and Sneed Sherrill S
Home Financials for this Owner
Home Financials are based on the most recent Mortgage that was taken out on this home.
Original Mortgage
$50,973
Interest Rate
7.98%
Mortgage Type
FHA
Create a Home Valuation Report for This Property
The Home Valuation Report is an in-depth analysis detailing your home's value as well as a comparison with similar homes in the area
Home Values in the Area
Average Home Value in this Area
Purchase History
| Date | Buyer | Sale Price | Title Company |
|---|---|---|---|
| Jones Hermon C | $45,500 | None Available | |
| Federal National Mortgage Association | -- | None Available | |
| Hud | $75,406 | -- | |
| Bloomfield Stuart | $68,900 | Equity Title & Escrow Co | |
| Bloomfield Stuart | $68,900 | Equity Title & Escrow Co | |
| Sneed Richard P | $51,000 | -- | |
| Sneed Richard P | $51,000 | -- |
Source: Public Records
Mortgage History
| Date | Status | Borrower | Loan Amount |
|---|---|---|---|
| Previous Owner | Bloomfield Stuart | $68,336 | |
| Previous Owner | Sneed Richard P | $50,973 |
Source: Public Records
Tax History Compared to Growth
Tax History
| Year | Tax Paid | Tax Assessment Tax Assessment Total Assessment is a certain percentage of the fair market value that is determined by local assessors to be the total taxable value of land and additions on the property. | Land | Improvement |
|---|---|---|---|---|
| 2025 | $889 | $27,975 | $8,000 | $19,975 |
| 2024 | $889 | $26,225 | $4,425 | $21,800 |
| 2023 | $1,598 | $26,225 | $4,425 | $21,800 |
| 2022 | $1,598 | $26,225 | $4,425 | $21,800 |
| 2021 | $1,616 | $26,225 | $4,425 | $21,800 |
| 2020 | $1,054 | $14,550 | $4,425 | $10,125 |
| 2019 | $1,054 | $14,550 | $4,425 | $10,125 |
| 2018 | $1,054 | $14,550 | $4,425 | $10,125 |
| 2017 | $598 | $14,550 | $4,425 | $10,125 |
| 2016 | $590 | $13,500 | $0 | $0 |
| 2014 | $590 | $15,950 | $0 | $0 |
Source: Public Records
Map
Nearby Homes
- 1731 Sea Isle Rd
- 1771 Tahiti Ln
- 1783 Danville Rd
- 1776 Dorrie Ln
- 1782 Cornelia Ln
- 1886 Danville Rd
- 4487 E Dearing Rd
- 1903 Capri Rd
- 1711 Myrna Ln
- 1809 Cherry Rd
- 1628 Cherry Rd
- 4420 Helene Rd
- 4471 Jamaica Ave
- 1864 Denison St
- 4416 Boyce Rd
- 4436 Boyce Rd
- 1597 Marcia Rd
- 1570 Dearing Rd
- 1879 Ezell St
- 4491 Garnett Rd