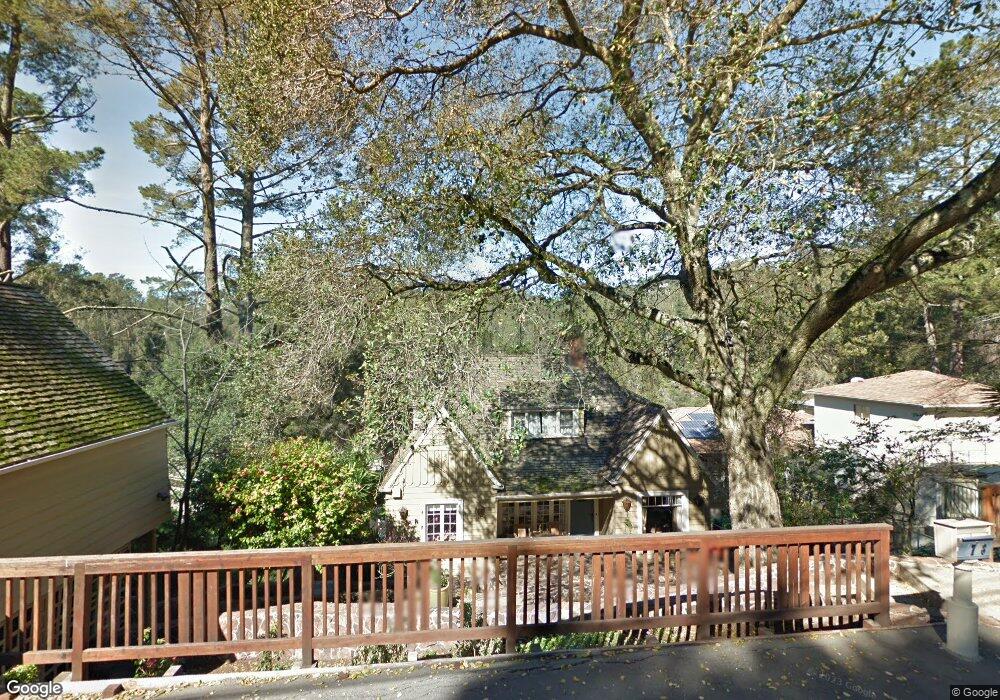
1758 Indian Way Oakland, CA 94611
Montclair NeighborhoodEstimated Value: $1,349,000 - $1,494,000
3
Beds
3
Baths
2,275
Sq Ft
$619/Sq Ft
Est. Value
About This Home
This home is located at 1758 Indian Way, Oakland, CA 94611 and is currently estimated at $1,408,290, approximately $619 per square foot. 1758 Indian Way is a home located in Alameda County with nearby schools including Thornhill Elementary School, Montera Middle School, and Skyline High School.
Ownership History
Date
Name
Owned For
Owner Type
Purchase Details
Closed on
Jan 23, 2025
Sold by
Dove Adam Michael and Dove Carrie
Bought by
2005 Dove Family Trust and Dove
Current Estimated Value
Purchase Details
Closed on
Feb 17, 2005
Sold by
Andary John and Andary Gwendolyn
Bought by
Dove Adam Michael and Dove Carrie
Home Financials for this Owner
Home Financials are based on the most recent Mortgage that was taken out on this home.
Original Mortgage
$649,700
Interest Rate
5%
Mortgage Type
Purchase Money Mortgage
Purchase Details
Closed on
Aug 25, 2004
Sold by
Mcmanus John H and Mcmanus Joan L
Bought by
Andary John and Andary Gwendolyn
Home Financials for this Owner
Home Financials are based on the most recent Mortgage that was taken out on this home.
Original Mortgage
$679,200
Interest Rate
4.62%
Mortgage Type
Purchase Money Mortgage
Purchase Details
Closed on
Mar 22, 1999
Sold by
Mcmanus John and Mcmanus Joan L
Bought by
Mcmanus John H and Mcmanus Joan L
Create a Home Valuation Report for This Property
The Home Valuation Report is an in-depth analysis detailing your home's value as well as a comparison with similar homes in the area
Home Values in the Area
Average Home Value in this Area
Purchase History
| Date | Buyer | Sale Price | Title Company |
|---|---|---|---|
| 2005 Dove Family Trust | -- | None Listed On Document | |
| Dove Adam Michael | $890,000 | First American Title Co | |
| Andary John | $849,000 | Fidelity National Title Co | |
| Mcmanus John H | -- | -- |
Source: Public Records
Mortgage History
| Date | Status | Borrower | Loan Amount |
|---|---|---|---|
| Previous Owner | Dove Adam Michael | $649,700 | |
| Previous Owner | Andary John | $679,200 | |
| Closed | Andary John | $84,900 |
Source: Public Records
Tax History Compared to Growth
Tax History
| Year | Tax Paid | Tax Assessment Tax Assessment Total Assessment is a certain percentage of the fair market value that is determined by local assessors to be the total taxable value of land and additions on the property. | Land | Improvement |
|---|---|---|---|---|
| 2025 | $17,475 | $1,233,463 | $383,289 | $857,174 |
| 2024 | $17,475 | $1,209,148 | $375,776 | $840,372 |
| 2023 | $18,420 | $1,192,306 | $368,409 | $823,897 |
| 2022 | $17,999 | $1,161,934 | $361,187 | $807,747 |
| 2021 | $17,385 | $1,139,016 | $354,106 | $791,910 |
| 2020 | $17,190 | $1,134,268 | $350,476 | $783,792 |
| 2019 | $16,654 | $1,112,037 | $343,607 | $768,430 |
| 2018 | $16,291 | $1,090,240 | $336,872 | $753,368 |
| 2017 | $15,708 | $1,068,871 | $330,269 | $738,602 |
| 2016 | $14,104 | $960,000 | $288,000 | $672,000 |
| 2015 | $12,351 | $823,000 | $246,900 | $576,100 |
| 2014 | $12,585 | $823,000 | $246,900 | $576,100 |
Source: Public Records
Map
Nearby Homes
- 1832 Woodhaven Way
- 6333 Thornhill Dr
- 6567 Thornhill Dr
- 6115 Doncaster Place
- 6406 Valley View Rd
- 6587 Thornhill Dr
- 6595 Thornhill Dr
- 6220 Valley View Rd
- 6687 Thornhill Dr
- 1801 Gouldin Rd
- 6258 Crown Ave
- 7130 Thorndale Dr
- 5915 Alhambra Ave
- 7030 Snake Rd
- 82 Oakwood Ct
- 0 Lauriston Ct Unit 225114615
- 0 Lauriston Ct Unit 225114614
- 0 Lauriston Ct Unit 225114613
- 6590 Oakwood Dr
- 00 Willowbank Ct
- 1762 Indian Way
- 1748 Indian Way
- 1752 Indian Way
- 1766 Indian Way
- 1742 Indian Way
- 1739 Woodhaven Way
- 1733 Woodhaven Way
- 1772 Indian Way
- 1745 Woodhaven Way
- 1751 Indian Way
- 1727 Woodhaven Way
- 1755 Woodhaven Way
- 1757 Indian Way
- 1761 Indian Way
- 1721 Woodhaven Way
- 1780 Indian Way
- 1767 Indian Way
- 1767 Woodhaven Way
- 1732 Indian Way
- 1747 Indian Way