Estimated Value: $181,000 - $203,000
4
Beds
1
Bath
1,126
Sq Ft
$174/Sq Ft
Est. Value
About This Home
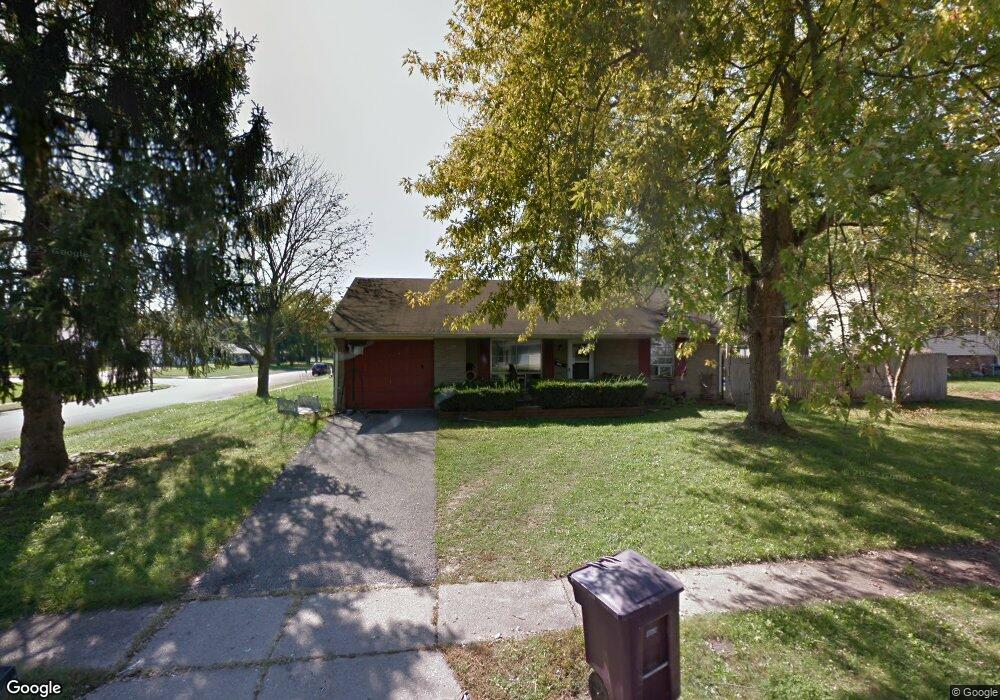
This home is located at 1758 Mumford Ct, Xenia, OH 45385 and is currently estimated at $195,750, approximately $173 per square foot. 1758 Mumford Ct is a home located in Greene County with nearby schools including Xenia High School, Summit Academy Community School for Alternative Learners - Xenia, and Legacy Christian Academy.
Ownership History
Date
Name
Owned For
Owner Type
Purchase Details
Closed on
Aug 26, 2022
Sold by
Sfr3-000 Llc
Bought by
Stearos Justice
Current Estimated Value
Home Financials for this Owner
Home Financials are based on the most recent Mortgage that was taken out on this home.
Original Mortgage
$157,102
Outstanding Balance
$150,056
Interest Rate
5.22%
Mortgage Type
FHA
Estimated Equity
$45,694
Purchase Details
Closed on
Oct 28, 2021
Sold by
Perry Frank L and Perry Julia A
Bought by
Sfr3-000 Llc
Purchase Details
Closed on
Jul 29, 2002
Sold by
Va
Bought by
Perry Frank L and Perry Julia A
Home Financials for this Owner
Home Financials are based on the most recent Mortgage that was taken out on this home.
Original Mortgage
$59,400
Interest Rate
6.62%
Purchase Details
Closed on
Dec 27, 2001
Sold by
Williams Charles and Williams Phyllis
Bought by
Va
Purchase Details
Closed on
Mar 31, 1998
Sold by
Margioras Marc A and Luckoski Casie A
Bought by
Williams Charles
Home Financials for this Owner
Home Financials are based on the most recent Mortgage that was taken out on this home.
Original Mortgage
$73,100
Interest Rate
7.09%
Mortgage Type
VA
Create a Home Valuation Report for This Property
The Home Valuation Report is an in-depth analysis detailing your home's value as well as a comparison with similar homes in the area
Home Values in the Area
Average Home Value in this Area
Purchase History
| Date | Buyer | Sale Price | Title Company |
|---|---|---|---|
| Stearos Justice | $160,000 | Rivertowne Title | |
| Sfr3-000 Llc | $192,500 | New Title Company Name | |
| Perry Frank L | -- | -- | |
| Va | $54,048 | -- | |
| Williams Charles | $71,000 | -- |
Source: Public Records
Mortgage History
| Date | Status | Borrower | Loan Amount |
|---|---|---|---|
| Open | Stearos Justice | $157,102 | |
| Previous Owner | Perry Frank L | $59,400 | |
| Previous Owner | Williams Charles | $73,100 |
Source: Public Records
Tax History Compared to Growth
Tax History
| Year | Tax Paid | Tax Assessment Tax Assessment Total Assessment is a certain percentage of the fair market value that is determined by local assessors to be the total taxable value of land and additions on the property. | Land | Improvement |
|---|---|---|---|---|
| 2024 | $2,340 | $54,680 | $12,180 | $42,500 |
| 2023 | $2,340 | $54,680 | $12,180 | $42,500 |
| 2022 | $1,948 | $38,830 | $7,160 | $31,670 |
| 2021 | $1,589 | $31,260 | $7,160 | $24,100 |
| 2020 | $1,523 | $31,260 | $7,160 | $24,100 |
| 2019 | $1,214 | $23,460 | $7,060 | $16,400 |
| 2018 | $1,219 | $23,460 | $7,060 | $16,400 |
| 2017 | $1,108 | $23,460 | $7,060 | $16,400 |
| 2016 | $1,108 | $20,930 | $7,060 | $13,870 |
| 2015 | $1,111 | $20,930 | $7,060 | $13,870 |
| 2014 | $1,064 | $20,930 | $7,060 | $13,870 |
Source: Public Records
Map
Nearby Homes
- 1866 Roxbury Dr
- 1908 Whitt St
- 1255 Colorado Dr
- 1829 Gayhart Dr
- 1403 Texas Dr
- 1769 Gayhart Dr
- 1107 Arkansas Dr
- 1778 Arapaho Dr
- 2499 Jenny Marie Dr
- 2257 Maryland Dr
- 2345 Tennessee Dr
- 2540 Jenny Marie Dr
- 2421 Louisiana Dr
- 1653 Seneca Dr
- 1618 Navajo Dr
- 2540 Cornwall Dr
- 2142 Michigan Dr
- 0 Berkshire Dr Unit 942854
- 1272 Bellbrook Ave
- 2545 Harmony Dr
- 1870 Atkinson Dr
- 1770 Mumford Ct
- 1830 Mumford Ct
- 1884 Atkinson Dr
- 1855 Atkinson Dr
- 1900 Owen Ct
- 1782 Mumford Ct
- 1841 Atkinson Dr
- 1818 Mumford Ct
- 1816 Atkinson Dr
- 1827 Atkinson Dr
- 1902 Atkinson Dr
- 1913 Whitt St
- 1806 Mumford Ct
- 1794 Mumford Ct
- 1873 Whitt St
- 1912 Owen Ct
- 1901 Owen Ct
- 1893 Whitt St
- 1859 Whitt St