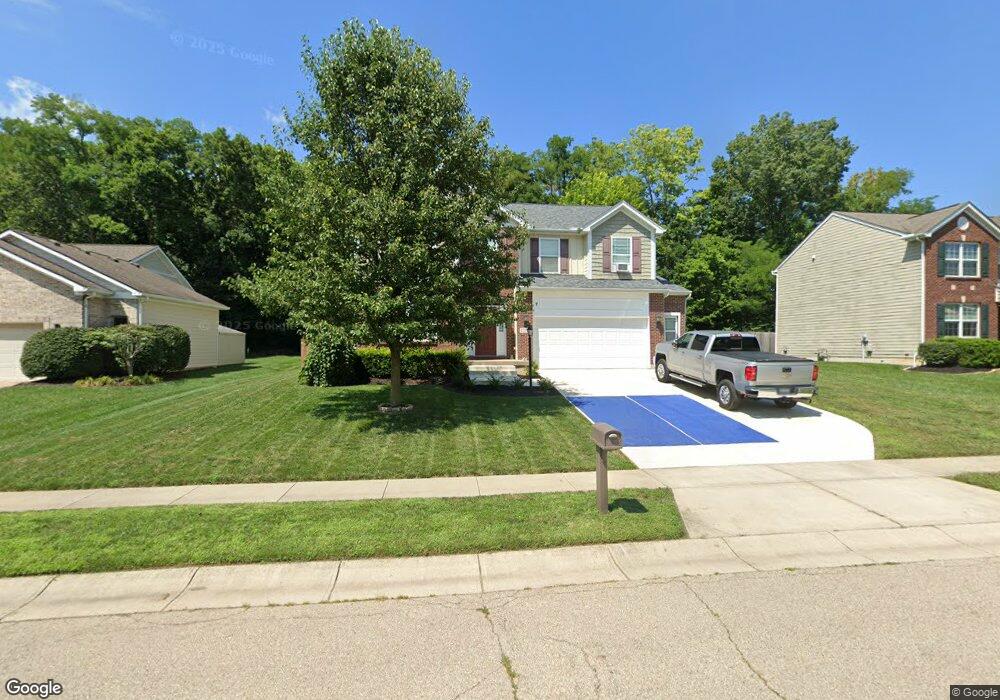
1758 Sandy Ct Springboro, OH 45066
Estimated Value: $433,029 - $486,000
3
Beds
3
Baths
2,560
Sq Ft
$180/Sq Ft
Est. Value
About This Home
This home is located at 1758 Sandy Ct, Springboro, OH 45066 and is currently estimated at $460,507, approximately $179 per square foot. 1758 Sandy Ct is a home with nearby schools including Clearcreek Elementary School, Springboro Intermediate School, and Dennis Elementary School.
Ownership History
Date
Name
Owned For
Owner Type
Purchase Details
Closed on
May 11, 2016
Sold by
Gallion James D and Gallion Anna M
Bought by
Gallion James D and Gallion Anna M
Current Estimated Value
Purchase Details
Closed on
Oct 30, 2014
Sold by
Cristo Homes Inc
Bought by
Gallion James D and Gallion Anna M
Home Financials for this Owner
Home Financials are based on the most recent Mortgage that was taken out on this home.
Original Mortgage
$194,200
Outstanding Balance
$60,553
Interest Rate
4.21%
Mortgage Type
Future Advance Clause Open End Mortgage
Estimated Equity
$399,954
Purchase Details
Closed on
Apr 8, 2014
Sold by
Heatherbloom Llc
Bought by
Cristo Homes Inc
Purchase Details
Closed on
Jan 25, 2012
Sold by
Lifetime Development Llc
Bought by
Heatherbloom Llc and Heather Bloom Llc
Create a Home Valuation Report for This Property
The Home Valuation Report is an in-depth analysis detailing your home's value as well as a comparison with similar homes in the area
Home Values in the Area
Average Home Value in this Area
Purchase History
| Date | Buyer | Sale Price | Title Company |
|---|---|---|---|
| Gallion James D | -- | None Available | |
| Gallion James D | $242,766 | None Available | |
| Cristo Homes Inc | $31,000 | J&J Title | |
| Heatherbloom Llc | -- | None Available |
Source: Public Records
Mortgage History
| Date | Status | Borrower | Loan Amount |
|---|---|---|---|
| Open | Gallion James D | $194,200 |
Source: Public Records
Tax History
| Year | Tax Paid | Tax Assessment Tax Assessment Total Assessment is a certain percentage of the fair market value that is determined by local assessors to be the total taxable value of land and additions on the property. | Land | Improvement |
|---|---|---|---|---|
| 2025 | $5,144 | $131,720 | $35,000 | $96,720 |
| 2024 | $5,144 | $131,720 | $35,000 | $96,720 |
| 2023 | $4,384 | $102,963 | $17,220 | $85,743 |
| 2022 | $4,320 | $102,963 | $17,220 | $85,743 |
| 2021 | $4,020 | $102,963 | $17,220 | $85,743 |
| 2020 | $3,739 | $83,710 | $14,000 | $69,710 |
| 2019 | $3,447 | $83,710 | $14,000 | $69,710 |
| 2018 | $3,450 | $83,710 | $14,000 | $69,710 |
| 2017 | $3,501 | $76,531 | $13,013 | $63,518 |
| 2016 | $3,652 | $76,531 | $13,013 | $63,518 |
| 2015 | $3,660 | $76,531 | $13,013 | $63,518 |
| 2014 | $459 | $8,840 | $8,840 | $0 |
| 2013 | $459 | $9,800 | $9,800 | $0 |
Source: Public Records
Map
Nearby Homes
- 50 Morris St
- 45 Morris St Unit 15
- 8 Glasgow St Unit 30
- 65 Morris St Unit 17
- 45 Morris St
- 18 Glasgow St Unit 29
- 8 Glasgow St
- 18 Glasgow St
- 30 Morris St
- 50 Morris St Unit 4
- 65 Morris St
- 7 W Long Meadow Dr
- 60 Rosewood Dr
- 330 East St
- 210 Dan Haven Bend
- 84 W Mill St
- 175 Farmridge Rd
- 20 Inverness Ct
- 25 Morris St
- 25 Morris St Unit 13
Your Personal Tour Guide
Ask me questions while you tour the home.