Estimated Value: $647,619 - $789,000
5
Beds
4
Baths
2,522
Sq Ft
$275/Sq Ft
Est. Value
About This Home
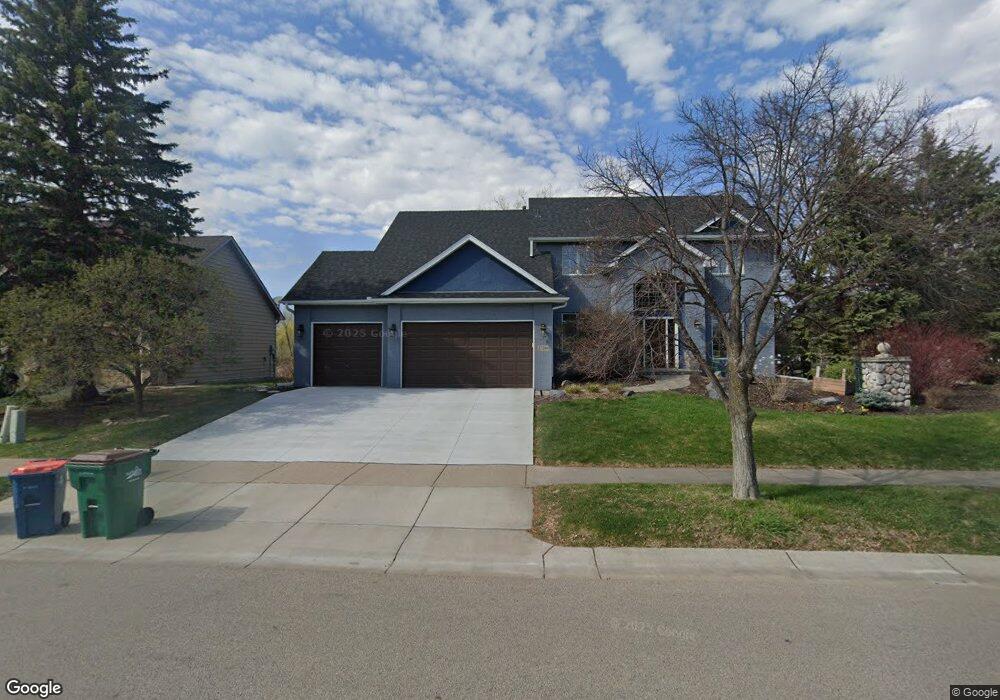
This home is located at 17580 79th Place N, Osseo, MN 55311 and is currently estimated at $694,655, approximately $275 per square foot. 17580 79th Place N is a home located in Hennepin County with nearby schools including Rush Creek Elementary School, Maple Grove Middle School, and Maple Grove Senior High School.
Ownership History
Date
Name
Owned For
Owner Type
Purchase Details
Closed on
Mar 24, 2021
Sold by
Weinkauf Meredith and Weinkauf Todd
Bought by
Weinkauf Meredith and Weinkauf Todd
Current Estimated Value
Purchase Details
Closed on
Apr 15, 2013
Sold by
Backes Glen B and De Leon Eva M
Bought by
Weinkauf Todd J and Weinkauf Meredith J
Home Financials for this Owner
Home Financials are based on the most recent Mortgage that was taken out on this home.
Original Mortgage
$405,000
Outstanding Balance
$286,263
Interest Rate
3.5%
Mortgage Type
New Conventional
Estimated Equity
$408,392
Purchase Details
Closed on
Jul 28, 2003
Sold by
Carlat Jon
Bought by
Backes Glen and Deleon Eva
Purchase Details
Closed on
Oct 19, 2001
Sold by
Silverman Brandt J and Silverman Pamela L
Bought by
Carlat Jon D
Purchase Details
Closed on
Sep 27, 2000
Sold by
Kresal Custom Homes Inc
Bought by
Silverman Brandt and Silverman Pamela
Purchase Details
Closed on
Apr 23, 1999
Sold by
Jms Dev Corp
Bought by
Kresal Custom Homes Inc
Create a Home Valuation Report for This Property
The Home Valuation Report is an in-depth analysis detailing your home's value as well as a comparison with similar homes in the area
Home Values in the Area
Average Home Value in this Area
Purchase History
| Date | Buyer | Sale Price | Title Company |
|---|---|---|---|
| Weinkauf Meredith | -- | None Available | |
| Weinkauf Todd J | $436,764 | Custom Home Builders Title L | |
| Backes Glen | $495,000 | -- | |
| Carlat Jon D | $399,000 | -- | |
| Silverman Brandt | $311,855 | -- | |
| Kresal Custom Homes Inc | $68,900 | -- |
Source: Public Records
Mortgage History
| Date | Status | Borrower | Loan Amount |
|---|---|---|---|
| Open | Weinkauf Todd J | $405,000 |
Source: Public Records
Tax History Compared to Growth
Tax History
| Year | Tax Paid | Tax Assessment Tax Assessment Total Assessment is a certain percentage of the fair market value that is determined by local assessors to be the total taxable value of land and additions on the property. | Land | Improvement |
|---|---|---|---|---|
| 2024 | $7,288 | $582,700 | $82,800 | $499,900 |
| 2023 | $7,389 | $608,700 | $103,100 | $505,600 |
| 2022 | $6,002 | $598,700 | $108,200 | $490,500 |
| 2021 | $5,802 | $494,500 | $67,500 | $427,000 |
| 2020 | $6,069 | $470,100 | $75,500 | $394,600 |
| 2019 | $6,216 | $466,900 | $77,300 | $389,600 |
| 2018 | $6,236 | $451,400 | $76,300 | $375,100 |
| 2017 | $6,365 | $434,600 | $68,000 | $366,600 |
| 2016 | $6,593 | $443,800 | $83,000 | $360,800 |
| 2015 | $6,738 | $441,200 | $98,000 | $343,200 |
| 2014 | -- | $415,500 | $98,000 | $317,500 |
Source: Public Records
Map
Nearby Homes
- 8048 Narcissus Ln N
- 7731 Queensland Ln N
- 16997 78th Place N
- 16878 79th Place N
- 16824 79th Ave N
- 17005 78th Ct N
- 7722 Everest Ln N
- 7547 Inland Ln N
- 7788 Everest Ct N
- 7461 Merrimac Ln N
- 7200 Comstock Ln N
- 7585 Blackoaks Ln N
- 16917 73rd Place N
- 8200 Walnut Grove Ln N
- 8347 Zanzibar Ct N
- 16955 Weaver Lake Dr
- 18715 85th Ave N
- 18141 87th Ave N
- 7201 Jewel Ln N Unit 907
- 17344 72nd Ave N Unit 1304
- 17580 79th Place N
- 17602 79th Place N
- 17577 79th Place N
- 17624 79th Place N
- 7951 Kimberly Ln N
- 17599 79th Place N
- 7963 Kimberly Ln N
- 17621 79th Place N
- 7945 Kimberly Ln N
- 17646 79th Place N
- 7937 Lawndale Ln N
- 7933 Kimberly Ln N
- 17653 79th Place N
- 7985 Kimberly Ln N
- 17701 80th Ct N
- 17688 79th Place N
- 17688 79th Place N
- 17723 80th Ct N
- 7952 Kimberly Ln N
- 7925 Lawndale Ln N