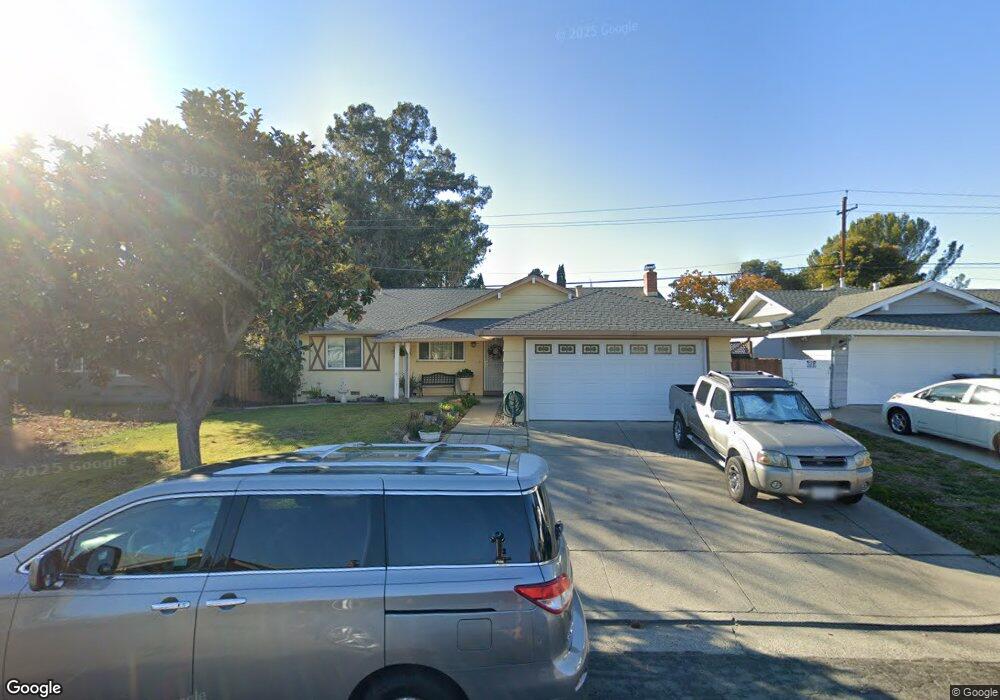
1759 Hemlock St Fairfield, CA 94533
Estimated Value: $474,000 - $501,000
About This Home
This home is located at 1759 Hemlock St, Fairfield, CA 94533 and is currently estimated at $491,153, approximately $385 per square foot. 1759 Hemlock St is a home located in Solano County with nearby schools including Anna Kyle Elementary School, Grange Middle School, and Fairfield High School.
Ownership History
We collect this data history from publicly available records. To have your information removed, we recommend requesting removal directly through your county’s website.
Purchase Details
Home Financials for this Owner
Home Financials are based on the most recent Mortgage that was taken out on this home.Home Values in the Area
Average Home Value in this Area
Purchase History
We collect this data history from publicly available records. To have your information removed, we recommend requesting removal directly through your county’s website.
| Date | Buyer | Sale Price | Title Company |
|---|---|---|---|
| $181,500 | Fidelity National Title Co |
Mortgage History
We collect this data history from publicly available records. To have your information removed, we recommend requesting removal directly through your county’s website.
| Date | Status | Borrower | Loan Amount |
|---|---|---|---|
| Open | $184,824 |
Tax History
We collect this data history from publicly available records. To have your information removed, we recommend requesting removal directly through your county’s website.
| Year | Tax Paid | Tax Assessment Tax Assessment Total Assessment is a certain percentage of the fair market value that is determined by local assessors to be the total taxable value of land and additions on the property. | Land | Improvement |
|---|---|---|---|---|
| 2025 | $2,984 | $273,032 | $67,802 | $205,230 |
| 2024 | $2,984 | $267,679 | $66,473 | $201,206 |
| 2023 | $2,892 | $262,431 | $65,170 | $197,261 |
| 2022 | $2,855 | $257,287 | $63,893 | $193,394 |
| 2021 | $2,825 | $252,243 | $62,641 | $189,602 |
| 2020 | $2,759 | $249,657 | $61,999 | $187,658 |
| 2019 | $2,690 | $244,763 | $60,784 | $183,979 |
| 2018 | $2,774 | $239,965 | $59,593 | $180,372 |
| 2017 | $2,645 | $235,261 | $58,425 | $176,836 |
| 2016 | $2,620 | $230,649 | $57,280 | $173,369 |
| 2015 | $2,445 | $227,185 | $56,420 | $170,765 |
| 2014 | $2,380 | $219,000 | $44,000 | $175,000 |
Map
- 1719 Elm St
- 378 Acacia St
- 1831 Clay St
- 1713 Fillmore St
- 1718 Fillmore St
- 1712 Fillmore St
- 499 Apple Tree Ln
- 1712 Arthur Ct
- 362 Tabor Ave
- 343 Arizona St
- 1500 Monroe St
- 1500 Harrison St
- 1517 Garfield St
- 1669 Rutledge Ln
- 1660 Glenmore Dr
- 1123 Tabor Ave
- 337 Colorado St
- 133 E Travis Blvd
- 218 E Wyoming St
- 937 Pacific Ave
Ask me questions while you tour the home.