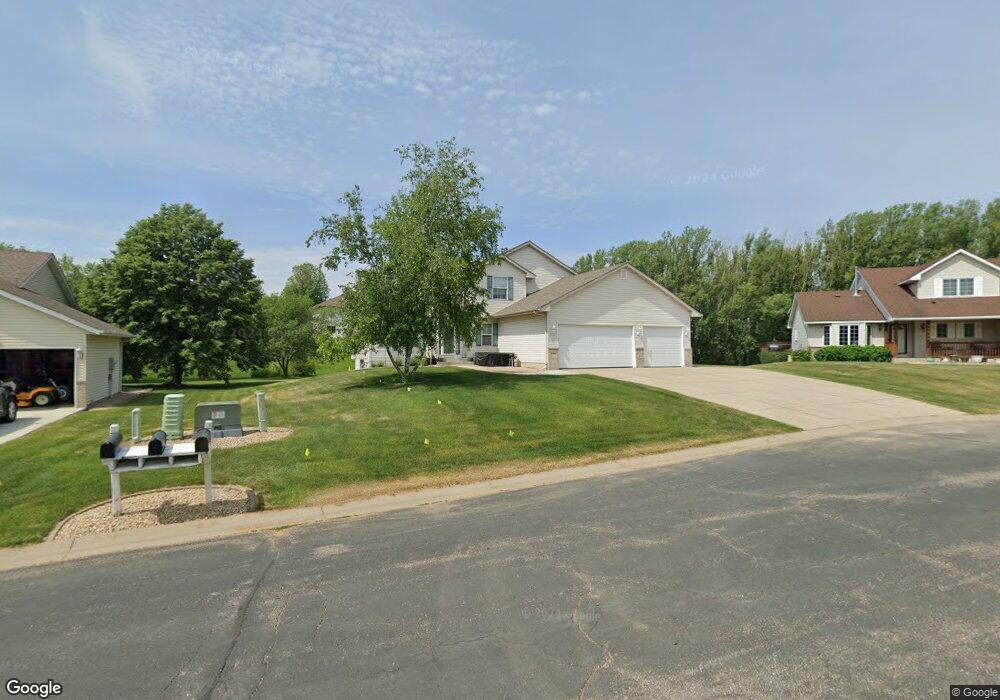
17594 Foxboro Ct Farmington, MN 55024
Estimated Value: $529,656 - $534,000
5
Beds
4
Baths
2,044
Sq Ft
$260/Sq Ft
Est. Value
About This Home
This home is located at 17594 Foxboro Ct, Farmington, MN 55024 and is currently estimated at $532,414, approximately $260 per square foot. 17594 Foxboro Ct is a home located in Dakota County with nearby schools including North Trail Elementary School, Levi P. Dodge Middle School, and Farmington High School.
Ownership History
Date
Name
Owned For
Owner Type
Purchase Details
Closed on
Jul 14, 2008
Sold by
Garrison Kelly J and Garrison Kimberly L
Bought by
Nguyen Trac N
Current Estimated Value
Home Financials for this Owner
Home Financials are based on the most recent Mortgage that was taken out on this home.
Original Mortgage
$248,000
Interest Rate
6.52%
Mortgage Type
New Conventional
Purchase Details
Closed on
May 1, 2007
Sold by
Us Bank Na
Bought by
Garrison Kelly Joseph and Garrison Kimberly Lynn
Purchase Details
Closed on
Jan 28, 2005
Sold by
Wright Sherri L
Bought by
Tweed Kyle
Purchase Details
Closed on
Aug 8, 2000
Sold by
Key-Land Homes
Bought by
Wright Sherri L and Wright Clinton R
Purchase Details
Closed on
Jul 31, 2000
Sold by
Green Ridge Associates L L P
Bought by
Key-Land Homes
Create a Home Valuation Report for This Property
The Home Valuation Report is an in-depth analysis detailing your home's value as well as a comparison with similar homes in the area
Home Values in the Area
Average Home Value in this Area
Purchase History
| Date | Buyer | Sale Price | Title Company |
|---|---|---|---|
| Nguyen Trac N | $310,000 | -- | |
| Garrison Kelly Joseph | $289,000 | -- | |
| Tweed Kyle | $422,000 | -- | |
| Wright Sherri L | $232,357 | -- | |
| Key-Land Homes | $47,900 | -- |
Source: Public Records
Mortgage History
| Date | Status | Borrower | Loan Amount |
|---|---|---|---|
| Previous Owner | Nguyen Trac N | $248,000 |
Source: Public Records
Tax History Compared to Growth
Tax History
| Year | Tax Paid | Tax Assessment Tax Assessment Total Assessment is a certain percentage of the fair market value that is determined by local assessors to be the total taxable value of land and additions on the property. | Land | Improvement |
|---|---|---|---|---|
| 2024 | $5,330 | $486,300 | $88,800 | $397,500 |
| 2023 | $5,330 | $494,900 | $88,600 | $406,300 |
| 2022 | $4,934 | $469,900 | $88,300 | $381,600 |
| 2021 | $4,644 | $393,400 | $76,800 | $316,600 |
| 2020 | $4,788 | $361,100 | $76,700 | $284,400 |
| 2019 | $4,702 | $359,400 | $73,000 | $286,400 |
| 2018 | $4,512 | $351,600 | $69,500 | $282,100 |
| 2017 | $4,432 | $331,900 | $66,200 | $265,700 |
| 2016 | $4,516 | $317,100 | $63,000 | $254,100 |
| 2015 | $4,122 | $301,968 | $59,384 | $242,584 |
| 2014 | -- | $296,518 | $57,619 | $238,899 |
| 2013 | -- | $273,846 | $52,294 | $221,552 |
Source: Public Records
Map
Nearby Homes
- 17583 Foxboro Ln
- 17698 Fortune Trail
- 17830 Glasgow Way
- 6882 173rd St W
- 17891 Glasgow Way
- 17937 Genoa Dr
- 17408 Gettysburg Way Unit 24184
- Ashton Plan at Cordelia - Freedom
- Hadley Plan at Cordelia - Freedom
- 17901 Genoa Dr
- Duncan Plan at Cordelia - Freedom
- 17896 Glasgow Way
- 17934 Genoa Dr
- 17936 Genoa Dr
- 17935 Giants Way
- 17940 Genoa Dr
- 17942 Genoa Dr
- 17944 Genoa Dr
- 17415 Fireside Ln
- 17867 Flint Ave
- 17608 Foxboro Ct
- 17582 Foxboro Ct
- 17614 Gage Ave
- 17626 Gage Ave
- 17594 Gage Ave
- 17578 Gage Ave
- 17618 Foxboro Ct
- 17585 Foxboro Ct
- 17607 Foxboro Ct
- 17638 Gage Ave
- 17566 Gage Ave
- 17638 Gage Ave
- 17593 Foxboro Ct
- 17554 Gage Ave
- 17650 Gage Ave
- 17597 Foxboro Ln
- 17597 17597 Foxboro Ln
- 17630 Foxboro Ct
- 17532 Freeport Way
- 17536 Freeport Way