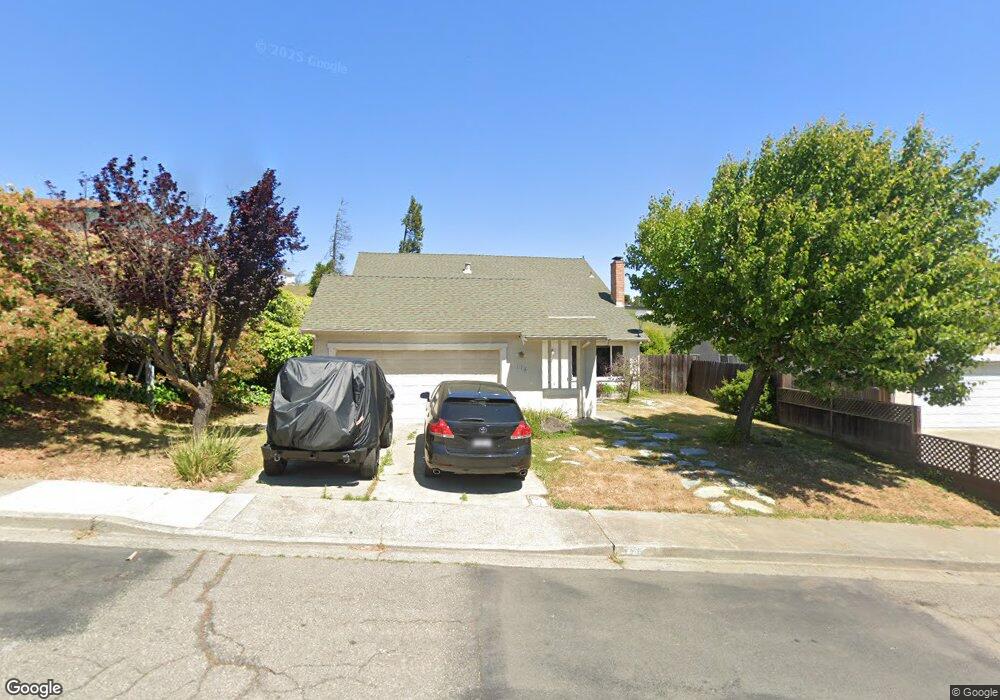
176 Carlisle Way Benicia, CA 94510
Estimated Value: $744,391 - $911,000
3
Beds
3
Baths
2,236
Sq Ft
$373/Sq Ft
Est. Value
About This Home
This home is located at 176 Carlisle Way, Benicia, CA 94510 and is currently estimated at $834,098, approximately $373 per square foot. 176 Carlisle Way is a home located in Solano County with nearby schools including Matthew Turner Elementary School, Benicia Middle School, and Benicia High School.
Ownership History
Date
Name
Owned For
Owner Type
Purchase Details
Closed on
Dec 28, 2012
Sold by
Zaks Rhea and Rhea Zaks Family Living Trust
Bought by
Zaks Rhea
Current Estimated Value
Home Financials for this Owner
Home Financials are based on the most recent Mortgage that was taken out on this home.
Original Mortgage
$103,800
Interest Rate
3.27%
Mortgage Type
New Conventional
Purchase Details
Closed on
Feb 18, 2012
Sold by
Zaks Rhea
Bought by
Zaks Rhea and Rhea Zaks Family Living Trust
Purchase Details
Closed on
Jan 15, 1999
Sold by
Zaks Rhea G
Bought by
Zaks Rhea G
Home Financials for this Owner
Home Financials are based on the most recent Mortgage that was taken out on this home.
Original Mortgage
$120,000
Interest Rate
6.63%
Purchase Details
Closed on
Oct 23, 1997
Sold by
Zaks Walter J
Bought by
Zaks Rhea G
Create a Home Valuation Report for This Property
The Home Valuation Report is an in-depth analysis detailing your home's value as well as a comparison with similar homes in the area
Home Values in the Area
Average Home Value in this Area
Purchase History
| Date | Buyer | Sale Price | Title Company |
|---|---|---|---|
| Zaks Rhea | -- | Orange Coast Title | |
| Zaks Rhea | -- | Accommodation | |
| Zaks Rhea | -- | None Available | |
| Zaks Rhea G | -- | North American Title Co | |
| Zaks Rhea G | -- | -- |
Source: Public Records
Mortgage History
| Date | Status | Borrower | Loan Amount |
|---|---|---|---|
| Closed | Zaks Rhea | $103,800 | |
| Closed | Zaks Rhea G | $120,000 |
Source: Public Records
Tax History Compared to Growth
Tax History
| Year | Tax Paid | Tax Assessment Tax Assessment Total Assessment is a certain percentage of the fair market value that is determined by local assessors to be the total taxable value of land and additions on the property. | Land | Improvement |
|---|---|---|---|---|
| 2025 | $3,995 | $340,362 | $91,987 | $248,375 |
| 2024 | $3,995 | $333,689 | $90,184 | $243,505 |
| 2023 | $3,899 | $327,147 | $88,416 | $238,731 |
| 2022 | $3,827 | $320,733 | $86,683 | $234,050 |
| 2021 | $3,749 | $314,445 | $84,984 | $229,461 |
| 2020 | $3,699 | $311,222 | $84,113 | $227,109 |
| 2019 | $3,635 | $305,120 | $82,464 | $222,656 |
| 2018 | $3,543 | $299,139 | $80,848 | $218,291 |
| 2017 | $3,461 | $293,274 | $79,263 | $214,011 |
| 2016 | $3,486 | $287,524 | $77,709 | $209,815 |
| 2015 | $3,397 | $283,206 | $76,542 | $206,664 |
| 2014 | $3,358 | $277,659 | $75,043 | $202,616 |
Source: Public Records
Map
Nearby Homes
- 362 Allen Way
- 101 Panorama Dr
- 102 Banbury Way
- 212 Panorama Dr
- 253 Carlisle Way
- 132 Chelsea Hills Dr
- 263 Carlisle Way
- 473 Mccall Dr
- 481 Mccall Dr
- 112 Inverness Ct
- 331 Larkin Dr
- 403 Gerald Ct
- 2016 Clearview Cir
- 117 Sunset Cir Unit 37
- 117 Sunset Cir Unit 36
- 117 Sunset Cir Unit 34
- 2000 Clearview Cir
- 564 Rose Dr
- 432 Turner Dr
- 570 Daffodil Dr
- 174 Carlisle Way
- 178 Carlisle Way
- 172 Carlisle Way
- 180 Carlisle Way
- 173 Carlisle Way
- 175 Carlisle Way
- 170 Carlisle Way
- 177 Carlisle Way
- 171 Carlisle Way
- 182 Carlisle Way
- 168 Carlisle Way
- 169 Carlisle Way
- 179 Carlisle Way
- 167 Carlisle Way
- 166 Carlisle Way
- 184 Carlisle Way
- 181 Carlisle Way
- 164 Carlisle Way
- 165 Carlisle Way
- 186 Carlisle Way