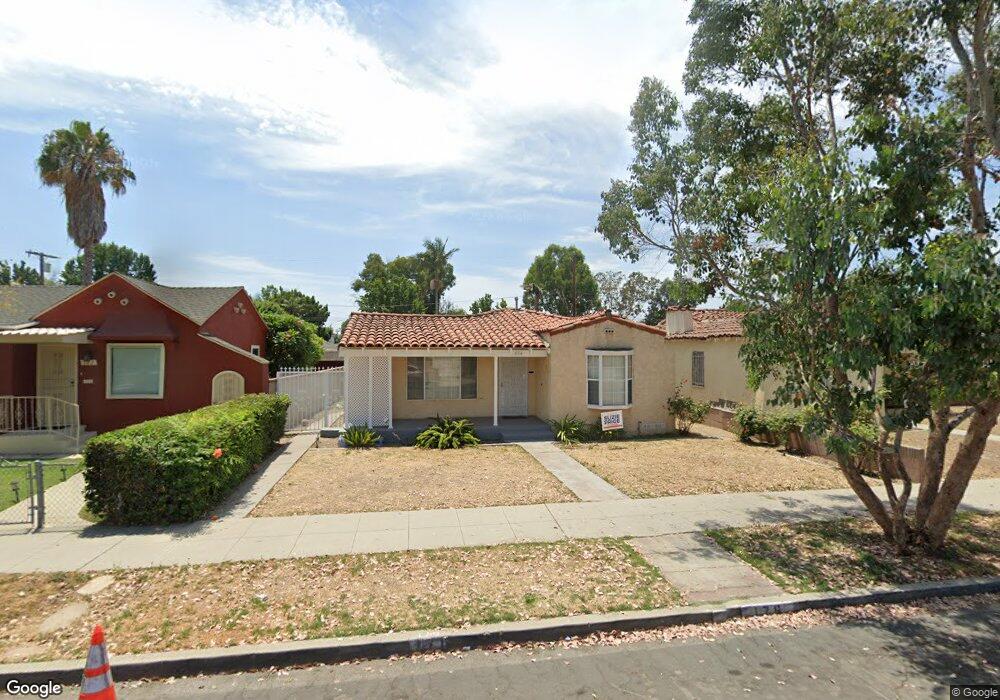
176 E Barclay St Long Beach, CA 90805
Coolidge Triangle NeighborhoodEstimated Value: $638,000 - $724,000
2
Beds
1
Bath
1,054
Sq Ft
$636/Sq Ft
Est. Value
About This Home
This home is located at 176 E Barclay St, Long Beach, CA 90805 and is currently estimated at $670,782, approximately $636 per square foot. 176 E Barclay St is a home located in Los Angeles County with nearby schools including Colin Powell Academy for Success and Jordan High School.
Ownership History
Date
Name
Owned For
Owner Type
Purchase Details
Closed on
Apr 17, 2006
Sold by
Hollie Lydia A and Dilworth Ethel M
Bought by
Hollie Lydia A
Current Estimated Value
Home Financials for this Owner
Home Financials are based on the most recent Mortgage that was taken out on this home.
Original Mortgage
$237,200
Outstanding Balance
$136,232
Interest Rate
6.35%
Mortgage Type
New Conventional
Estimated Equity
$534,550
Purchase Details
Closed on
Mar 31, 2005
Sold by
Hollie Lydia A and Dilworth Ethel M
Bought by
Hollie Lydia A
Purchase Details
Closed on
Oct 22, 2004
Sold by
Hollie Lydia A
Bought by
Hollie Lydia A and Dilworth Ethel M
Home Financials for this Owner
Home Financials are based on the most recent Mortgage that was taken out on this home.
Original Mortgage
$185,000
Interest Rate
6.12%
Mortgage Type
New Conventional
Purchase Details
Closed on
Aug 2, 2001
Sold by
Dilworth Ethel M
Bought by
Dilworth Ethel M and Hollie Lydia A
Create a Home Valuation Report for This Property
The Home Valuation Report is an in-depth analysis detailing your home's value as well as a comparison with similar homes in the area
Home Values in the Area
Average Home Value in this Area
Purchase History
| Date | Buyer | Sale Price | Title Company |
|---|---|---|---|
| Hollie Lydia A | -- | New Century Title Company | |
| Hollie Lydia A | -- | -- | |
| Hollie Lydia A | -- | Landsafe Title | |
| Hollie Lydia A | -- | Landsafe Title | |
| Dilworth Ethel M | -- | -- |
Source: Public Records
Mortgage History
| Date | Status | Borrower | Loan Amount |
|---|---|---|---|
| Open | Hollie Lydia A | $237,200 | |
| Closed | Hollie Lydia A | $185,000 |
Source: Public Records
Tax History
| Year | Tax Paid | Tax Assessment Tax Assessment Total Assessment is a certain percentage of the fair market value that is determined by local assessors to be the total taxable value of land and additions on the property. | Land | Improvement |
|---|---|---|---|---|
| 2025 | $3,225 | $240,460 | $167,446 | $73,014 |
| 2024 | $3,225 | $235,746 | $164,163 | $71,583 |
| 2023 | $3,167 | $231,125 | $160,945 | $70,180 |
| 2022 | $2,980 | $226,594 | $157,790 | $68,804 |
| 2021 | $2,914 | $222,152 | $154,697 | $67,455 |
| 2019 | $2,871 | $215,564 | $150,109 | $65,455 |
| 2018 | $2,744 | $211,338 | $147,166 | $64,172 |
| 2016 | $2,524 | $203,133 | $141,452 | $61,681 |
| 2015 | $2,425 | $200,083 | $139,328 | $60,755 |
| 2014 | $2,413 | $196,164 | $136,599 | $59,565 |
Source: Public Records
Map
Nearby Homes
- 200 E Barclay St
- 155 E Barclay St
- 6110 Long Beach Blvd
- 161 W Harcourt St
- 274 E 65th St
- 140 W Bort St
- 110 W Forhan St
- 275 E Artesia Blvd
- 6067 Jaymills Ave
- 223 E Marker St
- 6475 Atlantic Ave Unit 911
- 6475 Atlantic Ave Unit 815
- 180 E 67th St
- 246 E Hullett St
- 410 E 60th St
- 447 E Adair St
- 6665 Long Beach Blvd
- 6665 Long Beach Blvd Unit B23
- 260 E South St
- 6165 Linden Ave
- 182 E Barclay St
- 168 E Barclay St
- 188 E Barclay St
- 156 E Barclay St
- 167 E Allington St
- 177 E Allington St
- 179 E Allington St
- 155 E Allington St
- 148 E Barclay St
- 208 E Barclay St
- 181 E Barclay St
- 175 E Barclay St
- 205 E Allington St
- 189 E Barclay St
- 169 E Barclay St
- 161 E Barclay St
- 201 E Barclay St
- 149 E Allington St
- 140 E Barclay St
- 220 E Barclay St
Your Personal Tour Guide
Ask me questions while you tour the home.