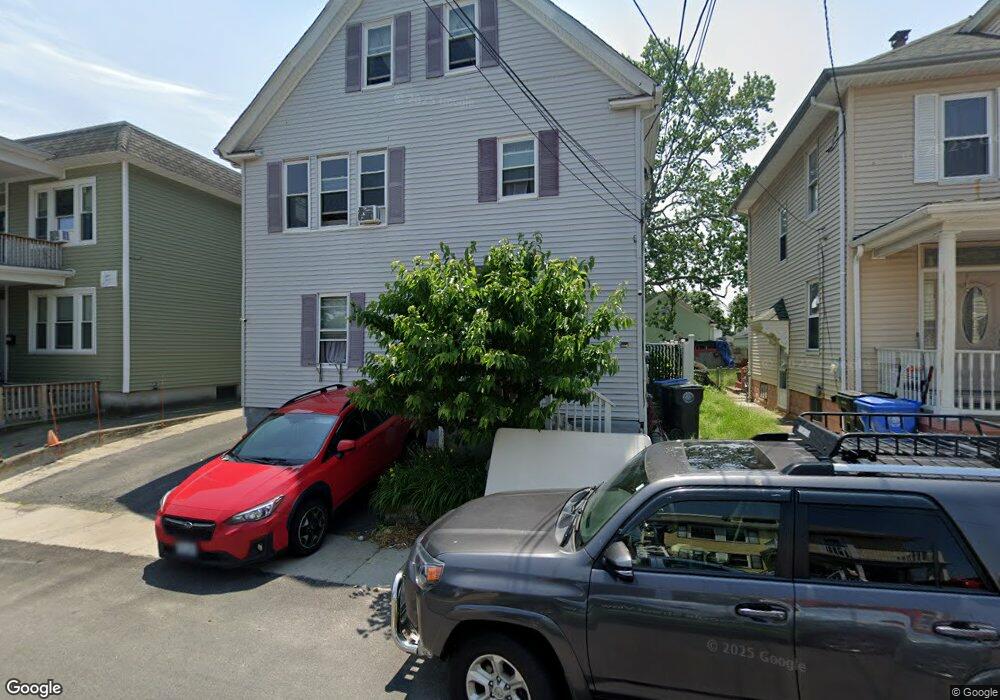
176 Eldridge St Cranston, RI 02910
Spectacle NeighborhoodEstimated Value: $535,068 - $674,000
8
Beds
3
Baths
2,834
Sq Ft
$221/Sq Ft
Est. Value
About This Home
This home is located at 176 Eldridge St, Cranston, RI 02910 and is currently estimated at $626,267, approximately $220 per square foot. 176 Eldridge St is a home located in Providence County with nearby schools including Stadium Elementary School, Hugh B. Bain Middle School, and Cranston High School East.
Ownership History
Date
Name
Owned For
Owner Type
Purchase Details
Closed on
May 5, 2022
Sold by
Linsangan Ferdinand
Bought by
Linsangan Ferdinand
Current Estimated Value
Purchase Details
Closed on
Dec 18, 2017
Sold by
Linsangan Ferdinand and Linsangan Benedicto
Bought by
Linsangan Ferdinand
Purchase Details
Closed on
Jan 7, 2013
Sold by
Linsangan Ferdinand M and Linsangan Iluminada E
Bought by
Linsangan Ferdinand and Linsangan Benedicto
Purchase Details
Closed on
Feb 18, 2004
Sold by
Padula Stephen
Bought by
Linsangan Ferdinand and Linsangan Benedicto
Home Financials for this Owner
Home Financials are based on the most recent Mortgage that was taken out on this home.
Original Mortgage
$255,884
Interest Rate
5.83%
Mortgage Type
Purchase Money Mortgage
Create a Home Valuation Report for This Property
The Home Valuation Report is an in-depth analysis detailing your home's value as well as a comparison with similar homes in the area
Home Values in the Area
Average Home Value in this Area
Purchase History
| Date | Buyer | Sale Price | Title Company |
|---|---|---|---|
| Linsangan Ferdinand | -- | None Available | |
| Linsangan Ferdinand | -- | None Available | |
| Linsangan Ferdinand | -- | -- | |
| Linsangan Ferdinand | -- | -- | |
| Linsangan Ferdinand | $260,000 | -- |
Source: Public Records
Mortgage History
| Date | Status | Borrower | Loan Amount |
|---|---|---|---|
| Previous Owner | Linsangan Ferdinand | $19,059 | |
| Previous Owner | Linsangan Ferdinand | $26,000 | |
| Previous Owner | Linsangan Ferdinand | $255,884 |
Source: Public Records
Tax History
| Year | Tax Paid | Tax Assessment Tax Assessment Total Assessment is a certain percentage of the fair market value that is determined by local assessors to be the total taxable value of land and additions on the property. | Land | Improvement |
|---|---|---|---|---|
| 2025 | $6,855 | $493,900 | $94,300 | $399,600 |
| 2024 | $6,722 | $493,900 | $94,300 | $399,600 |
| 2023 | $5,661 | $299,500 | $65,100 | $234,400 |
| 2022 | $5,514 | $297,900 | $63,500 | $234,400 |
| 2021 | $5,362 | $297,900 | $63,500 | $234,400 |
| 2020 | $4,997 | $240,600 | $60,300 | $180,300 |
| 2019 | $4,997 | $240,600 | $60,300 | $180,300 |
| 2018 | $4,882 | $240,600 | $60,300 | $180,300 |
| 2017 | $4,159 | $181,300 | $44,500 | $136,800 |
| 2016 | $4,070 | $181,300 | $44,500 | $136,800 |
| 2015 | $4,070 | $181,300 | $44,500 | $136,800 |
| 2014 | $3,714 | $162,600 | $44,500 | $118,100 |
Source: Public Records
Map
Nearby Homes
- 180 Eldridge St
- 172 Eldridge St
- 182 Eldridge St
- 165 Legion Way
- 167 Legion Way
- 177 Eldridge St
- 159 Legion Way
- 173 Eldridge St
- 184 Eldridge St
- 179 Eldridge St
- 171 Legion Way
- 181 Eldridge St
- 155 Legion Way
- 181 Legion Way
- 185 Eldridge St
- 190 Eldridge St
- 166 Legion Way
- 183 Legion Way
- 172 Legion Way
- 191 Eldridge St
Your Personal Tour Guide
Ask me questions while you tour the home.