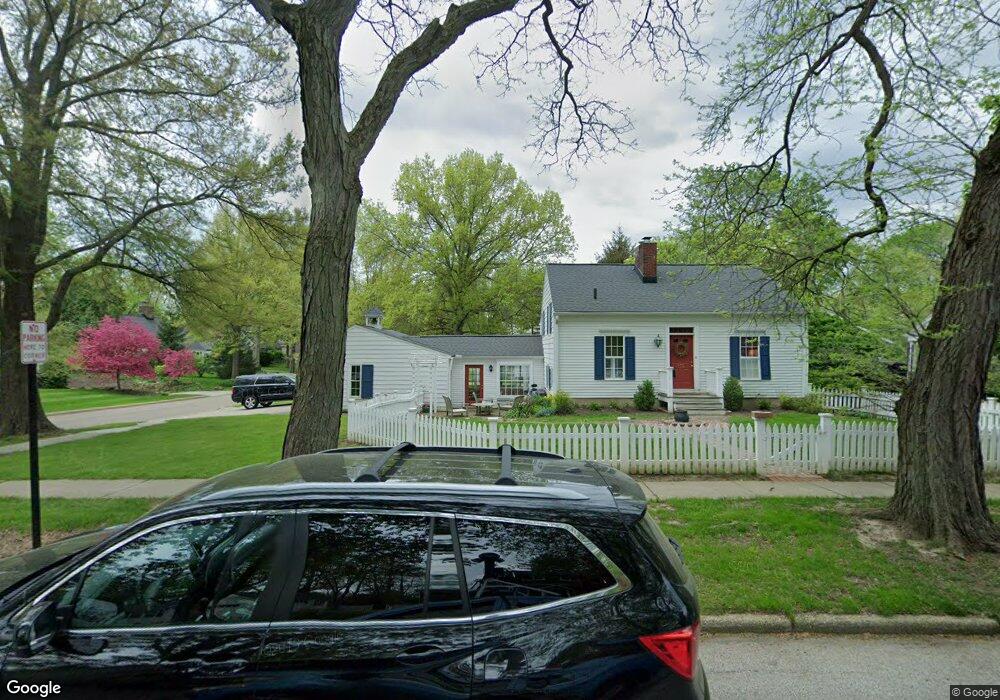
176 Elm St Hudson, OH 44236
Estimated Value: $349,373 - $548,000
3
Beds
2
Baths
780
Sq Ft
$569/Sq Ft
Est. Value
About This Home
This home is located at 176 Elm St, Hudson, OH 44236 and is currently estimated at $443,593, approximately $568 per square foot. 176 Elm St is a home located in Summit County with nearby schools including Ellsworth Hill Elementary School, East Woods Intermediate School, and Hudson Middle School.
Ownership History
Date
Name
Owned For
Owner Type
Purchase Details
Closed on
Jun 28, 2012
Sold by
Sveda Allan M
Bought by
Braham Coleson R and Larson Bridget K
Current Estimated Value
Home Financials for this Owner
Home Financials are based on the most recent Mortgage that was taken out on this home.
Original Mortgage
$182,700
Outstanding Balance
$126,167
Interest Rate
3.83%
Mortgage Type
New Conventional
Estimated Equity
$317,426
Purchase Details
Closed on
Nov 29, 2011
Sold by
Sveda Allan M
Bought by
Sveda Allan M and Garnet M Sveda Family Trust
Purchase Details
Closed on
Dec 17, 2008
Sold by
Sveda Allan M and Sveda Garnet M
Bought by
Sveda Garnet M and Garnet M Sveda Living Trust
Purchase Details
Closed on
Feb 23, 1999
Sold by
Christman Daniel W and Miller Charles D
Bought by
Sveda Allan M and Sveda Garnet M
Home Financials for this Owner
Home Financials are based on the most recent Mortgage that was taken out on this home.
Original Mortgage
$109,040
Interest Rate
6.92%
Create a Home Valuation Report for This Property
The Home Valuation Report is an in-depth analysis detailing your home's value as well as a comparison with similar homes in the area
Home Values in the Area
Average Home Value in this Area
Purchase History
| Date | Buyer | Sale Price | Title Company |
|---|---|---|---|
| Braham Coleson R | $203,000 | None Available | |
| Sveda Allan M | -- | Attorney | |
| Sveda Garnet M | -- | Attorney | |
| Sveda Allan M | $116,300 | Endress/Lawyers Title |
Source: Public Records
Mortgage History
| Date | Status | Borrower | Loan Amount |
|---|---|---|---|
| Open | Braham Coleson R | $182,700 | |
| Previous Owner | Sveda Allan M | $109,040 |
Source: Public Records
Tax History
| Year | Tax Paid | Tax Assessment Tax Assessment Total Assessment is a certain percentage of the fair market value that is determined by local assessors to be the total taxable value of land and additions on the property. | Land | Improvement |
|---|---|---|---|---|
| 2025 | $5,331 | $98,466 | $18,235 | $80,231 |
| 2024 | $5,146 | $98,466 | $18,235 | $80,231 |
| 2023 | $5,146 | $98,466 | $18,235 | $80,231 |
| 2022 | $4,938 | $84,158 | $15,586 | $68,572 |
| 2021 | $4,946 | $84,158 | $15,586 | $68,572 |
| 2020 | $4,861 | $84,160 | $15,590 | $68,570 |
| 2019 | $5,224 | $83,810 | $20,770 | $63,040 |
| 2018 | $5,208 | $83,810 | $20,770 | $63,040 |
| 2017 | $4,141 | $83,810 | $20,770 | $63,040 |
| 2016 | $4,232 | $67,290 | $17,170 | $50,120 |
| 2015 | $4,141 | $67,290 | $17,170 | $50,120 |
| 2014 | $4,153 | $67,290 | $17,170 | $50,120 |
| 2013 | $3,487 | $55,180 | $17,170 | $38,010 |
Source: Public Records
Map
Nearby Homes
- 213 E Streetsboro St
- 42 Fox Trace Ln
- 171 Ravenna St
- 105 Fox Trace Ln
- 338 Simon Rd
- 6492 Elmcrest Dr
- 6740 Pinebrooke Dr
- 24 Morning Song Ln
- 75 Atterbury Blvd Unit 214
- 5974 Anna Lee Dr
- 7350 Herrick Park Dr
- 1705 Barlow Rd
- 2714 Blue Heron Dr
- 34 Chadbourne Dr
- 61 Lake Forest Dr
- 6372 Hardwick Cir
- 1440 E Hines Hill Rd
- 1964 Regan Ct
- 154 State Route 303
- 7753 Red Fox Trail