Estimated Value: $623,000 - $711,000
3
Beds
2
Baths
2,268
Sq Ft
$285/Sq Ft
Est. Value
About This Home
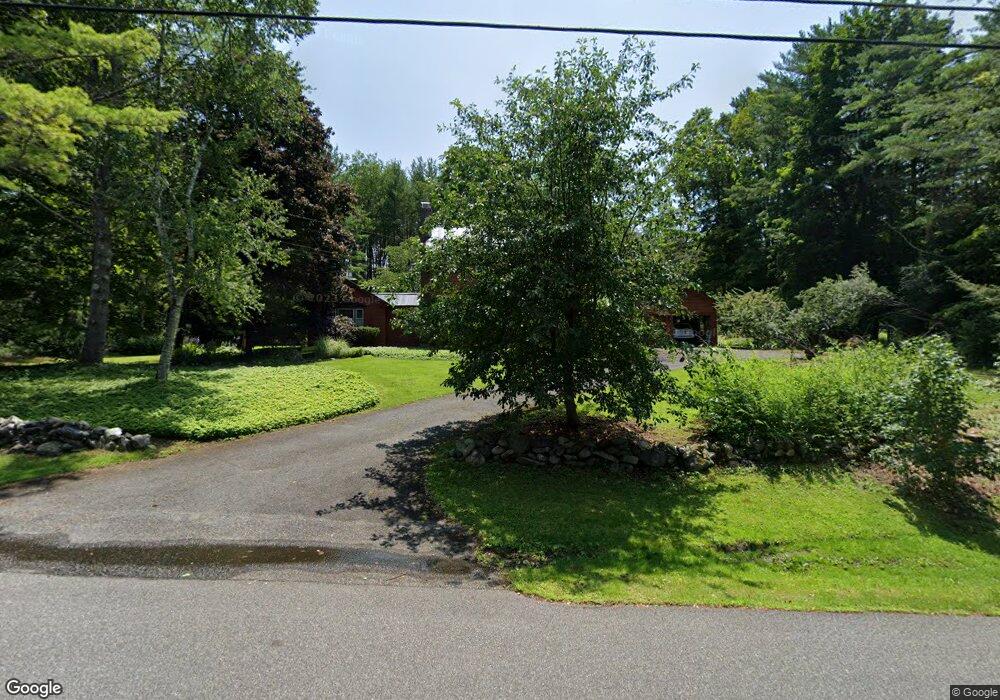
This home is located at 176 Hubbard St, Lenox, MA 01240 and is currently estimated at $645,733, approximately $284 per square foot. 176 Hubbard St is a home located in Berkshire County with nearby schools including Morris Elementary School, Lenox Memorial High School, and The Montessori School of the Berkshires.
Ownership History
Date
Name
Owned For
Owner Type
Purchase Details
Closed on
Jun 14, 2000
Sold by
Bartoni Daniel J and Macdowell Donna C
Bought by
Lane Michael D and Lane Andrew N
Current Estimated Value
Home Financials for this Owner
Home Financials are based on the most recent Mortgage that was taken out on this home.
Original Mortgage
$126,000
Outstanding Balance
$44,483
Interest Rate
8.24%
Mortgage Type
Purchase Money Mortgage
Estimated Equity
$601,250
Create a Home Valuation Report for This Property
The Home Valuation Report is an in-depth analysis detailing your home's value as well as a comparison with similar homes in the area
Home Values in the Area
Average Home Value in this Area
Purchase History
| Date | Buyer | Sale Price | Title Company |
|---|---|---|---|
| Lane Michael D | $180,000 | -- |
Source: Public Records
Mortgage History
| Date | Status | Borrower | Loan Amount |
|---|---|---|---|
| Open | Lane Michael D | $126,000 |
Source: Public Records
Tax History
| Year | Tax Paid | Tax Assessment Tax Assessment Total Assessment is a certain percentage of the fair market value that is determined by local assessors to be the total taxable value of land and additions on the property. | Land | Improvement |
|---|---|---|---|---|
| 2025 | $5,051 | $558,100 | $135,800 | $422,300 |
| 2024 | $4,778 | $526,800 | $128,100 | $398,700 |
| 2023 | $4,624 | $504,800 | $120,900 | $383,900 |
| 2022 | $4,124 | $380,400 | $100,800 | $279,600 |
| 2021 | $4,029 | $345,800 | $92,500 | $253,300 |
| 2020 | $4,124 | $340,800 | $89,800 | $251,000 |
| 2019 | $4,028 | $337,100 | $89,800 | $247,300 |
| 2018 | $4,052 | $333,800 | $88,100 | $245,700 |
| 2017 | $4,026 | $329,700 | $86,300 | $243,400 |
| 2016 | $3,997 | $328,700 | $86,300 | $242,400 |
| 2015 | $3,931 | $318,800 | $86,300 | $232,500 |
Source: Public Records
Map
Nearby Homes
- 0 East St
- 137 Housatonic St
- 54 Dunmore Ct
- 31 Saint Ann's Ave
- 130 E Dugway Rd
- 15 Hubbard St
- 4 Morgan Manor Unit 4
- 1 Pinecroft Dr
- 15 Wexford Ct Unit 32
- 46 Housatonic St Unit 2B
- 30 Clifden Ct Unit 2
- 9 October Hill Dr
- 18 Highcrest Rd
- 18 Highcrest Rd Unit 20
- 2 Saint Andrews Ct
- 220 Kemble St
- 399 Under Mountain Rd
- 249 Pittsfield Rd
- 500 Walker St
- 319 Under Mountain Rd
- 184 Hubbard St
- 170 Hubbard St
- 175 Hubbard St
- 190 Hubbard St
- 185 Hubbard St
- 16 Stoneledge Rd
- 15 Stoneledge Rd
- 196 Hubbard St
- 167 Hubbard St
- 160 Hubbard St
- 14 Stoneledge Rd
- 13 Stoneledge Rd
- 200 Hubbard St
- 150 Hubbard St
- 201 Hubbard St
- 204 Hubbard St
- 10 Stoneledge Rd
- 207 Hubbard St
- 11 Stoneledge Rd
- 146 Hubbard St
Your Personal Tour Guide
Ask me questions while you tour the home.