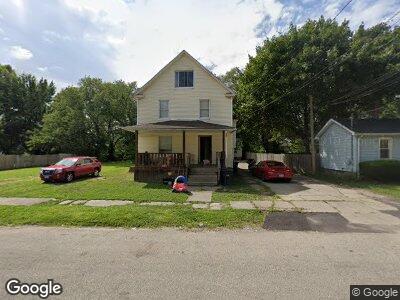
176 Logan Ave NE Warren, OH 44483
Hospital NeighborhoodEstimated Value: $59,098
4
Beds
2
Baths
1,456
Sq Ft
$41/Sq Ft
Est. Value
About This Home
This home is located at 176 Logan Ave NE, Warren, OH 44483 and is currently priced at $59,098, approximately $40 per square foot. 176 Logan Ave NE is a home located in Trumbull County with nearby schools including Warren G. Harding High School, Willard PK-8 School, and Steam Academy of Warren.
Ownership History
Date
Name
Owned For
Owner Type
Purchase Details
Closed on
May 9, 2019
Sold by
Boggs Dillon
Bought by
Cox Chad
Current Estimated Value
Purchase Details
Closed on
Sep 4, 2018
Sold by
Moorhead Investment Properties Llc
Bought by
Boggs Dillon
Purchase Details
Closed on
May 15, 2017
Sold by
Sexton Eva R
Bought by
Moorhead Investments Properties Llc
Purchase Details
Closed on
May 15, 2013
Sold by
Postlehwaite Perry R
Bought by
Sexton Eva R
Purchase Details
Closed on
Oct 4, 2006
Sold by
Postlethwaite Perry R
Bought by
Postlethwaite Perry R and Postlethwaite Ashlee Nicole
Purchase Details
Closed on
Oct 2, 2006
Sold by
Postlethwaite Perry R
Bought by
Postlethwaite Perry R and Postlethwaite Ashlee Nicole
Purchase Details
Closed on
Sep 29, 2006
Sold by
Theofilos Tykie and Theofilos Chrysoula T
Bought by
Postlethwaite Perry R
Purchase Details
Closed on
Sep 25, 2006
Sold by
Theofilos Tykie and Theofilos Chrysoula T
Bought by
Postlethwaite Perry R
Purchase Details
Closed on
Jan 1, 1990
Bought by
Tykie Theofilos
Create a Home Valuation Report for This Property
The Home Valuation Report is an in-depth analysis detailing your home's value as well as a comparison with similar homes in the area
Home Values in the Area
Average Home Value in this Area
Purchase History
| Date | Buyer | Sale Price | Title Company |
|---|---|---|---|
| Cox Chad | -- | None Available | |
| Boggs Dillon | $8,000 | None Available | |
| Moorhead Investments Properties Llc | -- | None Available | |
| Sexton Eva R | -- | None Available | |
| Postlethwaite Perry R | -- | None Available | |
| Postlethwaite Perry R | -- | None Available | |
| Postlethwaite Perry R | $13,000 | None Available | |
| Postlethwaite Perry R | $13,000 | None Available | |
| Tykie Theofilos | -- | -- |
Source: Public Records
Tax History Compared to Growth
Tax History
| Year | Tax Paid | Tax Assessment Tax Assessment Total Assessment is a certain percentage of the fair market value that is determined by local assessors to be the total taxable value of land and additions on the property. | Land | Improvement |
|---|---|---|---|---|
| 2024 | $1,016 | $20,060 | $1,580 | $18,480 |
| 2023 | $1,016 | $20,060 | $1,580 | $18,480 |
| 2022 | $826 | $12,750 | $1,580 | $11,170 |
| 2021 | $828 | $12,750 | $1,580 | $11,170 |
| 2020 | $829 | $12,750 | $1,580 | $11,170 |
| 2019 | $837 | $12,220 | $1,580 | $10,640 |
| 2018 | $834 | $12,220 | $1,580 | $10,640 |
| 2017 | $821 | $12,220 | $1,580 | $10,640 |
| 2016 | $845 | $13,030 | $2,280 | $10,750 |
| 2015 | $840 | $13,030 | $2,280 | $10,750 |
| 2014 | $835 | $13,030 | $2,280 | $10,750 |
| 2013 | $856 | $14,080 | $2,280 | $11,800 |
Source: Public Records
Map
Nearby Homes
- 179 Logan Ave NE
- 1250 Grant St SE
- 151 Bonnie Brae Ave NE
- 642 Saint Clair Dr NE
- 408 Chestnut Ave NE
- 437 Bonnie Brae Ave SE
- 1203 Woodland St NE
- 1536 Montclair St NE
- 318 Fairmount Ave NE
- 737 East Ave SE
- 433 Olive Ave NE Unit 435
- 767 East Ave SE
- 475 Homewood Ave SE
- 159 Kenilworth Ave SE
- 258 Seneca Ave NE
- 454 Vine Ave NE
- 181 Roselawn Ave NE
- 648 Woodbine Ave SE
- 405 Oak Knoll Ave SE
- 199 Genesee Ave NE
- 176 Logan Ave NE
- 176 Logan Ave NE
- 186 Logan Ave SE
- 166 Logan Ave SE
- 196 Logan Ave SE
- 167 Logan Ave SE
- 148 Logan Ave SE
- 206 Logan Ave SE
- 177 Logan Ave SE
- 197 Logan Ave SE
- 177 N Linden Ct
- 177 Linden Ave SE
- 169 N Linden Ct
- 157 Logan Ave SE
- 187 Linden Ave SE
- 140 Logan Ave SE
- 216 Logan Ave SE
- 143 Logan Ave SE
- 163 Logan Ave SE
- 207 Logan Ave SE