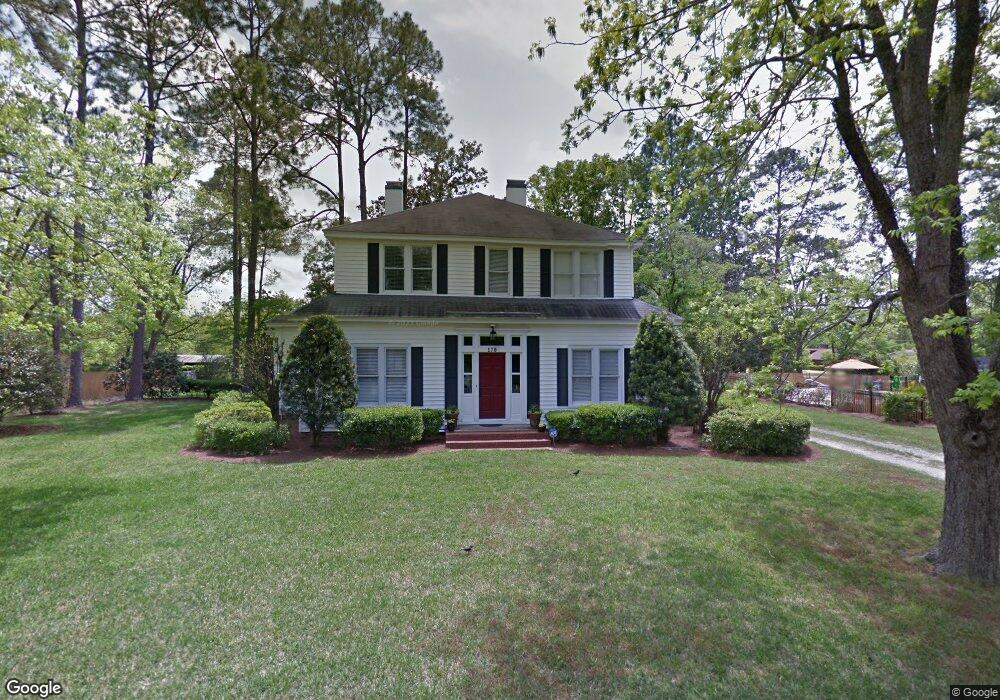
176 Main St Camilla, GA 31730
Estimated Value: $247,000 - $374,000
5
Beds
4
Baths
4,032
Sq Ft
$75/Sq Ft
Est. Value
About This Home
This home is located at 176 Main St, Camilla, GA 31730 and is currently estimated at $304,058, approximately $75 per square foot. 176 Main St is a home located in Mitchell County with nearby schools including Mitchell County Primary School, Mitchell County Elementary School, and Mitchell County Middle School.
Ownership History
Date
Name
Owned For
Owner Type
Purchase Details
Closed on
Mar 7, 2014
Sold by
Cooper Deborah A
Bought by
Cooper David L
Current Estimated Value
Purchase Details
Closed on
May 31, 2012
Sold by
Cooper David L
Bought by
Redding Thomas and Redding Sharon G
Purchase Details
Closed on
Jul 21, 2008
Sold by
Harrell Joan
Bought by
Cooper David
Home Financials for this Owner
Home Financials are based on the most recent Mortgage that was taken out on this home.
Original Mortgage
$145,600
Interest Rate
6.37%
Mortgage Type
New Conventional
Purchase Details
Closed on
May 22, 2007
Sold by
Mixon Julian Wayne
Bought by
Harrell Joan M
Purchase Details
Closed on
Apr 4, 2007
Sold by
Harrell Joan M
Bought by
Mixon Julian Wayne
Create a Home Valuation Report for This Property
The Home Valuation Report is an in-depth analysis detailing your home's value as well as a comparison with similar homes in the area
Home Values in the Area
Average Home Value in this Area
Purchase History
| Date | Buyer | Sale Price | Title Company |
|---|---|---|---|
| Cooper David L | -- | -- | |
| Redding Thomas | -- | -- | |
| Cooper David | $182,000 | -- | |
| Harrell Joan M | -- | -- | |
| Mixon Julian Wayne | -- | -- | |
| Harrell Joan M | -- | -- |
Source: Public Records
Mortgage History
| Date | Status | Borrower | Loan Amount |
|---|---|---|---|
| Previous Owner | Cooper David | $145,600 |
Source: Public Records
Tax History
| Year | Tax Paid | Tax Assessment Tax Assessment Total Assessment is a certain percentage of the fair market value that is determined by local assessors to be the total taxable value of land and additions on the property. | Land | Improvement |
|---|---|---|---|---|
| 2025 | $3,862 | $100,164 | $10,120 | $90,044 |
| 2024 | $3,867 | $100,164 | $10,120 | $90,044 |
| 2023 | $4,178 | $100,164 | $10,120 | $90,044 |
| 2022 | $3,336 | $79,364 | $10,120 | $69,244 |
| 2021 | $2,907 | $70,804 | $10,120 | $60,684 |
| 2020 | $2,907 | $70,804 | $10,120 | $60,684 |
| 2019 | $2,876 | $70,348 | $10,120 | $60,228 |
| 2018 | $2,845 | $65,214 | $10,186 | $55,028 |
| 2017 | $3,142 | $74,361 | $10,186 | $64,175 |
| 2016 | $3,102 | $74,361 | $10,186 | $64,175 |
| 2015 | $3,102 | $74,361 | $10,186 | $64,175 |
| 2014 | $3,102 | $74,361 | $10,186 | $64,175 |
| 2013 | $3,102 | $74,361 | $10,186 | $64,175 |
Source: Public Records
Map
Nearby Homes
Your Personal Tour Guide
Ask me questions while you tour the home.