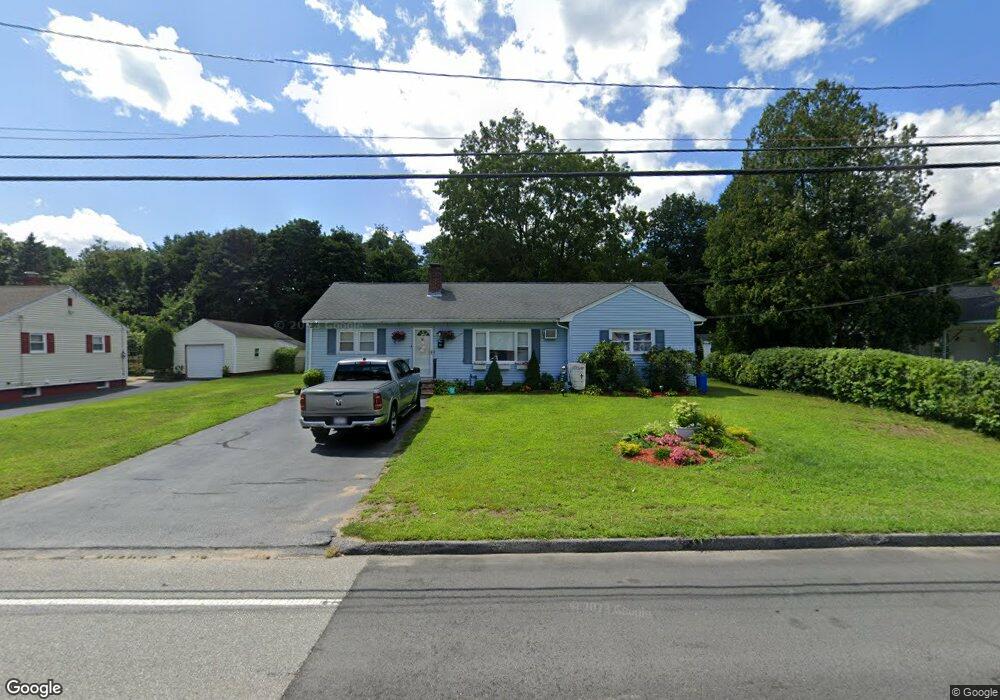
176 Manning St Hudson, MA 01749
Estimated Value: $460,000 - $483,000
3
Beds
1
Bath
1,154
Sq Ft
$412/Sq Ft
Est. Value
About This Home
This home is located at 176 Manning St, Hudson, MA 01749 and is currently estimated at $475,709, approximately $412 per square foot. 176 Manning St is a home located in Middlesex County with nearby schools including David J. Quinn Middle School, Hudson High School, and First Steps Children's Center.
Ownership History
Date
Name
Owned For
Owner Type
Purchase Details
Closed on
Apr 10, 2015
Sold by
Fontes Emilia C
Bought by
Emilia C Fontes Irt
Current Estimated Value
Purchase Details
Closed on
Sep 15, 1995
Sold by
Goodniss Mark M and Goodniss Diane M
Bought by
Fontes Joao S and Fontes Emilia C
Create a Home Valuation Report for This Property
The Home Valuation Report is an in-depth analysis detailing your home's value as well as a comparison with similar homes in the area
Home Values in the Area
Average Home Value in this Area
Purchase History
| Date | Buyer | Sale Price | Title Company |
|---|---|---|---|
| Emilia C Fontes Irt | -- | -- | |
| Emilia C Fontes Irt | -- | -- | |
| Fontes Joao S | $95,000 | -- |
Source: Public Records
Mortgage History
| Date | Status | Borrower | Loan Amount |
|---|---|---|---|
| Previous Owner | Fontes Joao S | $30,000 |
Source: Public Records
Tax History Compared to Growth
Tax History
| Year | Tax Paid | Tax Assessment Tax Assessment Total Assessment is a certain percentage of the fair market value that is determined by local assessors to be the total taxable value of land and additions on the property. | Land | Improvement |
|---|---|---|---|---|
| 2025 | $6,265 | $451,400 | $169,500 | $281,900 |
| 2024 | $5,984 | $427,400 | $154,000 | $273,400 |
| 2023 | $5,441 | $372,700 | $148,100 | $224,600 |
| 2022 | $5,080 | $320,300 | $134,600 | $185,700 |
| 2021 | $4,941 | $297,800 | $128,200 | $169,600 |
| 2020 | $4,656 | $280,300 | $125,600 | $154,700 |
| 2019 | $4,656 | $273,400 | $125,600 | $147,800 |
| 2018 | $6,732 | $257,100 | $119,700 | $137,400 |
| 2017 | $4,218 | $241,000 | $113,900 | $127,100 |
| 2016 | $3,928 | $227,200 | $113,900 | $113,300 |
| 2015 | $3,487 | $201,900 | $113,900 | $88,000 |
| 2014 | $3,414 | $196,000 | $99,900 | $96,100 |
Source: Public Records
Map
Nearby Homes
- 200 Manning St Unit 6C
- 200 Manning St Unit 14B
- 2 Barracks Rd Unit 2
- 1 Barracks Rd Unit 1
- 4 Richard Rd
- 133 Lincoln St
- 278 Manning St Unit 603
- 37 Tower St
- 55 Cottage St
- 248 Main St Unit 207
- 248 Main St Unit 210
- 16 Barnes Blvd Unit 16
- 65 Main St
- 16 Houghton St
- 12 Old County Rd Unit 20
- 346 Long Hill Rd
- 28 Pierce St
- 11 Barracks Rd Unit 11
- 32 Barracks Rd Unit 32
- 9 Barracks Rd Unit 9