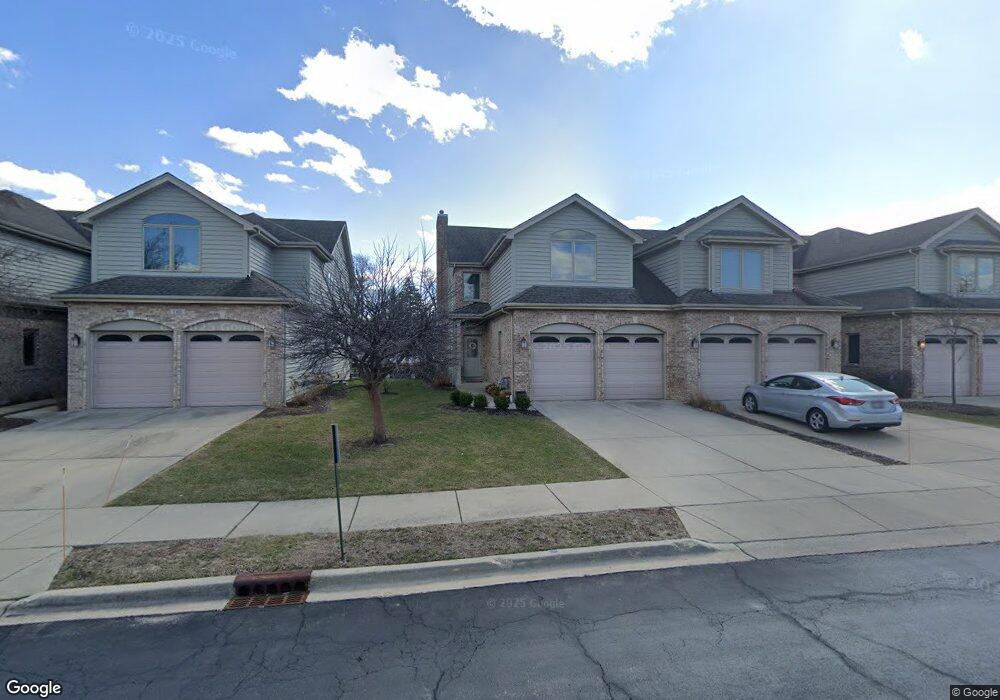
176 Mayo Ct Unit 10 Elmhurst, IL 60126
Estimated Value: $456,000 - $553,000
3
Beds
3
Baths
1,820
Sq Ft
$279/Sq Ft
Est. Value
About This Home
This home is located at 176 Mayo Ct Unit 10, Elmhurst, IL 60126 and is currently estimated at $508,426, approximately $279 per square foot. 176 Mayo Ct Unit 10 is a home located in DuPage County with nearby schools including Pulaski Intl School of Chicago, Revere Elementary School, and Jackson Elementary School.
Ownership History
Date
Name
Owned For
Owner Type
Purchase Details
Closed on
Oct 26, 2017
Sold by
Jeuch Sebastien and Jeuch Angela
Bought by
Sommer Jennifer Joy
Current Estimated Value
Purchase Details
Closed on
Jul 1, 2008
Sold by
Washington Mutual Bank
Bought by
Giraldo Angela and Jeuch Sebastien
Home Financials for this Owner
Home Financials are based on the most recent Mortgage that was taken out on this home.
Original Mortgage
$268,000
Interest Rate
6.11%
Mortgage Type
Purchase Money Mortgage
Purchase Details
Closed on
Sep 26, 2007
Sold by
Sokolovas Edgaras
Bought by
Washington Mutual Bank
Purchase Details
Closed on
Sep 15, 2006
Sold by
Lexington Estates Ltd
Bought by
Sokolovas Edgaras
Home Financials for this Owner
Home Financials are based on the most recent Mortgage that was taken out on this home.
Original Mortgage
$486,400
Interest Rate
7.62%
Mortgage Type
Purchase Money Mortgage
Create a Home Valuation Report for This Property
The Home Valuation Report is an in-depth analysis detailing your home's value as well as a comparison with similar homes in the area
Home Values in the Area
Average Home Value in this Area
Purchase History
| Date | Buyer | Sale Price | Title Company |
|---|---|---|---|
| Sommer Jennifer Joy | $370,000 | Attorney | |
| Giraldo Angela | $349,900 | Service Link | |
| Washington Mutual Bank | -- | None Available | |
| Sokolovas Edgaras | $609,000 | Pntn |
Source: Public Records
Mortgage History
| Date | Status | Borrower | Loan Amount |
|---|---|---|---|
| Previous Owner | Giraldo Angela | $268,000 | |
| Previous Owner | Sokolovas Edgaras | $486,400 |
Source: Public Records
Tax History Compared to Growth
Tax History
| Year | Tax Paid | Tax Assessment Tax Assessment Total Assessment is a certain percentage of the fair market value that is determined by local assessors to be the total taxable value of land and additions on the property. | Land | Improvement |
|---|---|---|---|---|
| 2024 | $7,350 | $140,636 | $14,069 | $126,567 |
| 2023 | $7,010 | $130,050 | $13,010 | $117,040 |
| 2022 | $7,362 | $134,360 | $13,440 | $120,920 |
| 2021 | $7,181 | $131,020 | $13,110 | $117,910 |
| 2020 | $6,893 | $128,150 | $12,820 | $115,330 |
| 2019 | $6,749 | $121,840 | $12,190 | $109,650 |
| 2018 | $6,407 | $115,340 | $11,540 | $103,800 |
| 2017 | $5,947 | $104,680 | $10,480 | $94,200 |
| 2016 | $5,816 | $98,610 | $9,870 | $88,740 |
| 2015 | $5,751 | $91,860 | $9,190 | $82,670 |
| 2014 | $4,829 | $72,280 | $7,230 | $65,050 |
| 2013 | $4,776 | $73,300 | $7,330 | $65,970 |
Source: Public Records
Map
Nearby Homes
- 110 W Butterfield Rd Unit 502S
- 162 E Hale St
- 900 S Colfax Ave
- 837 S Kearsage Ave
- 1005 S Mitchell Ave
- 15W320 Concord St
- 353 E Butterfield Rd
- 936 S Mitchell Ave
- 995 S Swain Ave
- 991 S Swain Ave
- 175 W Brush Hill Rd Unit 404
- 963 S Saylor Ave
- 1200 S Prospect Ave Unit 303
- 1200 S Prospect Ave Unit 108
- 426 E Harrison St
- 185 E Oneida Ave
- 2 S Atrium Way Unit 203
- 341 E Madison St
- 694 S York St
- 814 S Saylor Ave
- 176 Mayo Ct
- 172 Mayo Ct
- 180 Mayo Ct
- 180 Mayo Ct Unit 180
- 180 Mayo Ct Unit 2
- 168 Mayo Ct
- 168 Mayo Ct Unit 18
- 184 Mayo Ct
- 164 Mayo Ct
- 164 Mayo Ct Unit 19
- 188 Mayo Ct
- 188 Mayo Ct Unit 1
- 160 Mayo Ct
- 192 Mayo Ct
- 173 W Lexington St
- 169 W Lexington St
- 165 W Lexington St
- 165 W Lexington St Unit 165
- 165 W Lexington St Unit 16
- 156 Mayo Ct