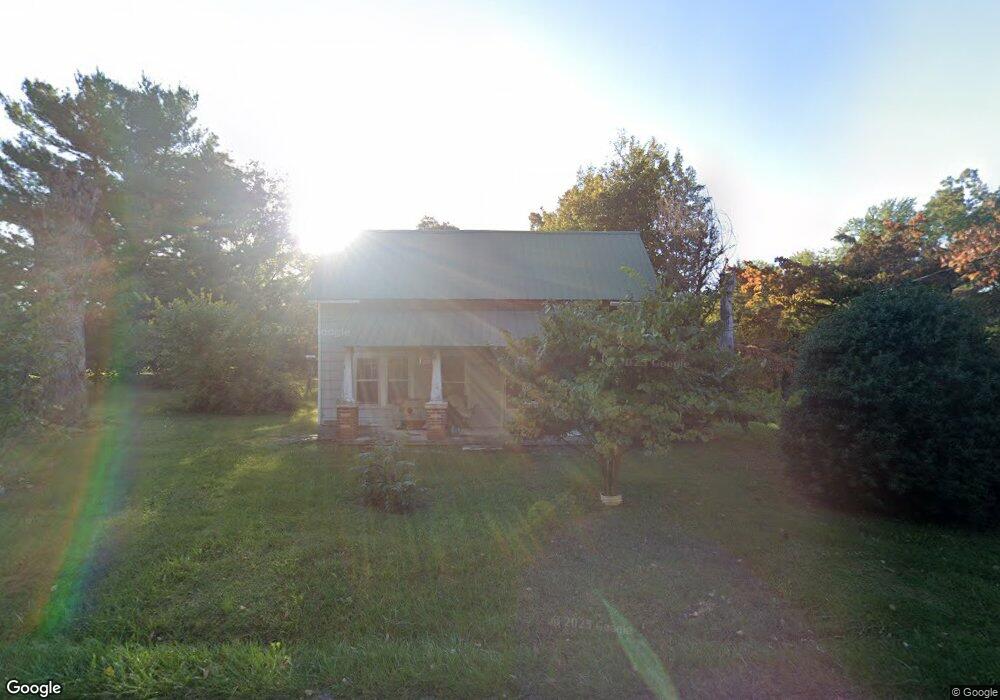
176 Mirandy Rd Cookeville, TN 38506
Estimated Value: $177,784 - $279,000
--
Bed
1
Bath
1,456
Sq Ft
$169/Sq Ft
Est. Value
About This Home
This home is located at 176 Mirandy Rd, Cookeville, TN 38506 and is currently estimated at $245,446, approximately $168 per square foot. 176 Mirandy Rd is a home located in Putnam County with nearby schools including Algood Middle School, Algood Elementary School, and Cookeville High School.
Ownership History
Date
Name
Owned For
Owner Type
Purchase Details
Closed on
Aug 29, 2023
Sold by
Bilbrey Glenda Gay
Bought by
Bilbrey Sarah Evelyn
Current Estimated Value
Purchase Details
Closed on
Oct 21, 2004
Sold by
Bilbrey David R
Bought by
Bilbrey Thomas Sarah
Purchase Details
Closed on
Oct 20, 1992
Bought by
Bilbrey Auda Mae L E
Purchase Details
Closed on
Sep 26, 1970
Bought by
Bilbrey Auda Mae
Create a Home Valuation Report for This Property
The Home Valuation Report is an in-depth analysis detailing your home's value as well as a comparison with similar homes in the area
Home Values in the Area
Average Home Value in this Area
Purchase History
| Date | Buyer | Sale Price | Title Company |
|---|---|---|---|
| Bilbrey Sarah Evelyn | -- | None Listed On Document | |
| Bilbrey Sarah Evelyn | -- | None Listed On Document | |
| Bilbrey Thomas Sarah | -- | -- | |
| Bilbrey Auda Mae L E | -- | -- | |
| Bilbrey Auda Mae | -- | -- |
Source: Public Records
Tax History Compared to Growth
Tax History
| Year | Tax Paid | Tax Assessment Tax Assessment Total Assessment is a certain percentage of the fair market value that is determined by local assessors to be the total taxable value of land and additions on the property. | Land | Improvement |
|---|---|---|---|---|
| 2024 | $712 | $26,775 | $5,475 | $21,300 |
| 2023 | $712 | $26,775 | $5,475 | $21,300 |
| 2022 | $662 | $26,775 | $5,475 | $21,300 |
| 2021 | $759 | $26,775 | $5,475 | $21,300 |
| 2020 | $451 | $26,775 | $5,475 | $21,300 |
| 2019 | $519 | $15,400 | $5,475 | $9,925 |
| 2018 | $495 | $15,400 | $5,475 | $9,925 |
| 2017 | $495 | $15,400 | $5,475 | $9,925 |
| 2016 | $499 | $15,400 | $5,475 | $9,925 |
| 2015 | $511 | $15,400 | $5,475 | $9,925 |
| 2014 | $541 | $16,296 | $0 | $0 |
Source: Public Records
Map
Nearby Homes