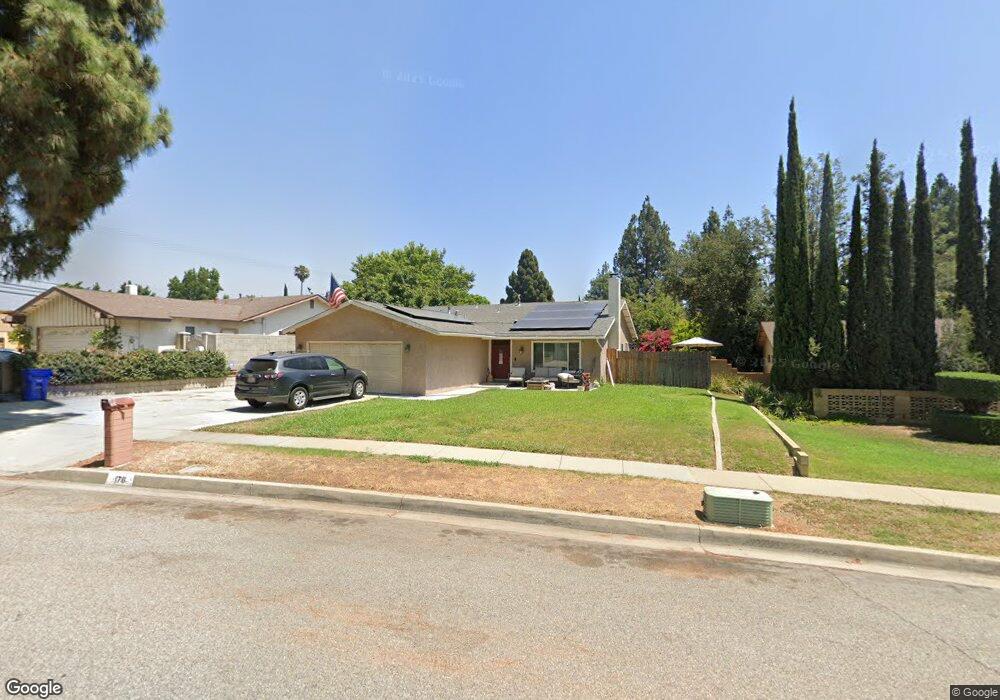
176 N Shasta Way Upland, CA 91786
Estimated Value: $704,000 - $790,000
3
Beds
2
Baths
1,440
Sq Ft
$517/Sq Ft
Est. Value
About This Home
This home is located at 176 N Shasta Way, Upland, CA 91786 and is currently estimated at $745,050, approximately $517 per square foot. 176 N Shasta Way is a home located in San Bernardino County with nearby schools including Baldy View Elementary School, Upland Junior High School, and Upland High School.
Ownership History
Date
Name
Owned For
Owner Type
Purchase Details
Closed on
Nov 17, 2000
Sold by
Corral Helen
Bought by
Hudrlik Dean and Hudrlik Brandie
Current Estimated Value
Home Financials for this Owner
Home Financials are based on the most recent Mortgage that was taken out on this home.
Original Mortgage
$98,400
Interest Rate
7.54%
Purchase Details
Closed on
Aug 20, 1996
Sold by
Barth Robert J and Barth Mary A Tr
Bought by
Corral Helen
Home Financials for this Owner
Home Financials are based on the most recent Mortgage that was taken out on this home.
Original Mortgage
$118,146
Interest Rate
8.06%
Mortgage Type
FHA
Create a Home Valuation Report for This Property
The Home Valuation Report is an in-depth analysis detailing your home's value as well as a comparison with similar homes in the area
Home Values in the Area
Average Home Value in this Area
Purchase History
| Date | Buyer | Sale Price | Title Company |
|---|---|---|---|
| Hudrlik Dean | $164,000 | Orange Coast Title | |
| Corral Helen | $119,000 | Continental Lawyers Title Co |
Source: Public Records
Mortgage History
| Date | Status | Borrower | Loan Amount |
|---|---|---|---|
| Previous Owner | Hudrlik Dean | $98,400 | |
| Previous Owner | Corral Helen | $118,146 |
Source: Public Records
Tax History Compared to Growth
Tax History
| Year | Tax Paid | Tax Assessment Tax Assessment Total Assessment is a certain percentage of the fair market value that is determined by local assessors to be the total taxable value of land and additions on the property. | Land | Improvement |
|---|---|---|---|---|
| 2025 | $2,768 | $247,129 | $86,495 | $160,634 |
| 2024 | $2,768 | $242,283 | $84,799 | $157,484 |
| 2023 | $2,725 | $237,532 | $83,136 | $154,396 |
| 2022 | $2,666 | $232,875 | $81,506 | $151,369 |
| 2021 | $2,660 | $228,309 | $79,908 | $148,401 |
| 2020 | $2,588 | $225,968 | $79,089 | $146,879 |
| 2019 | $2,580 | $221,537 | $77,538 | $143,999 |
| 2018 | $2,519 | $217,193 | $76,018 | $141,175 |
| 2017 | $2,447 | $212,934 | $74,527 | $138,407 |
| 2016 | $2,259 | $208,759 | $73,066 | $135,693 |
| 2015 | $2,208 | $205,623 | $71,968 | $133,655 |
| 2014 | $2,151 | $201,595 | $70,558 | $131,037 |
Source: Public Records
Map
Nearby Homes
- 537 W 9th St
- 435 W 9th St Unit F5
- 435 W 9th St Unit B3
- 164 Euclid Place
- 173 W 8th St
- 228 Greentree Rd
- 173 Elizabeth Ln
- Plan 3 at Towns on First - Towns On First
- Plan 4 at Towns on First - Towns On First
- 119 N 1st Ave
- 345 S Euclid Ave
- 384 W 7th St
- 424 W 7th St
- 1557 N Beverly Ct
- 595 Juniper Ave
- 855 N Palm Ave
- 340 W Caroline Ct
- 144 Dorsett Ave
- 181 Dorsett Ave
- 152 Dorsett Ave
- 194 N Shasta Way
- 158 N Shasta Way
- 179 Lucerne Way
- 165 Lucerne Way
- 193 Lucerne Way
- 140 N Shasta Way
- 544 W 9th St
- 151 Lucerne Way
- 159 N Shasta Way
- 517 W 9th St
- 139 Lucerne Way
- 143 N Shasta Way
- 122 N Shasta Way
- 519 W 9th St
- 578 W 9th St
- 521 W 9th St
- 123 Lucerne Way
- 156 N Tulare Way
- 531 W 9th St
- 523 W 9th St