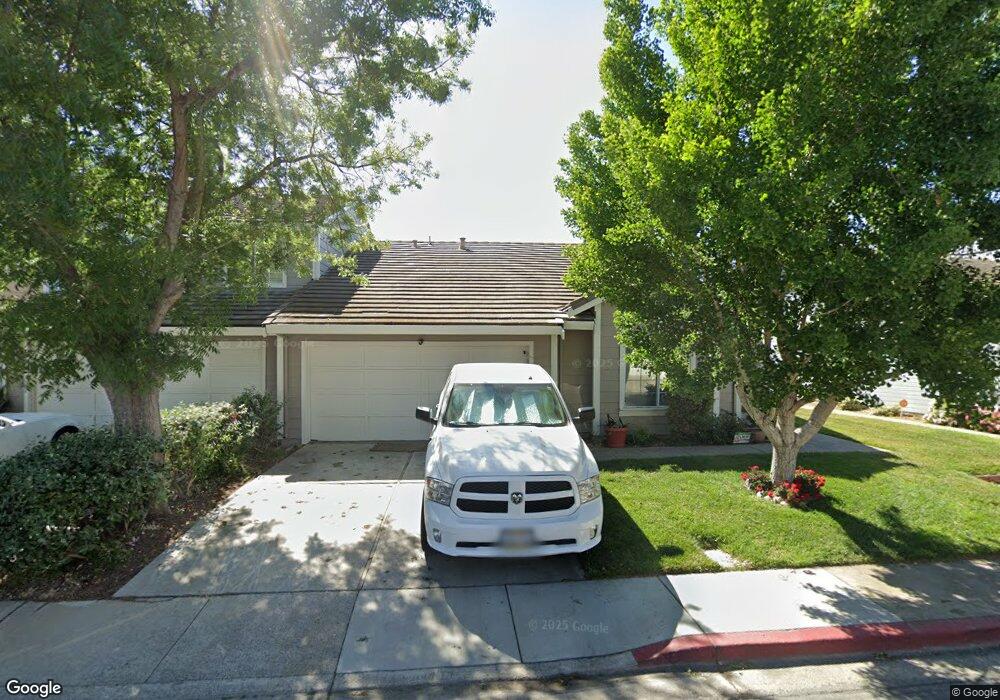
176 Pelican Loop Pittsburg, CA 94565
Downtown Pittsburg NeighborhoodEstimated Value: $520,000 - $566,000
3
Beds
2
Baths
1,505
Sq Ft
$358/Sq Ft
Est. Value
About This Home
This home is located at 176 Pelican Loop, Pittsburg, CA 94565 and is currently estimated at $538,551, approximately $357 per square foot. 176 Pelican Loop is a home located in Contra Costa County with nearby schools including Marina Vista Elementary School, Martin Luther King Jr. Junior High School, and Pittsburg Senior High School.
Ownership History
Date
Name
Owned For
Owner Type
Purchase Details
Closed on
Nov 28, 2000
Sold by
Riso Joseph & Frances A Tre
Bought by
Stephens Jon F
Current Estimated Value
Home Financials for this Owner
Home Financials are based on the most recent Mortgage that was taken out on this home.
Original Mortgage
$218,500
Outstanding Balance
$81,447
Interest Rate
7.86%
Mortgage Type
Purchase Money Mortgage
Estimated Equity
$457,104
Create a Home Valuation Report for This Property
The Home Valuation Report is an in-depth analysis detailing your home's value as well as a comparison with similar homes in the area
Home Values in the Area
Average Home Value in this Area
Purchase History
| Date | Buyer | Sale Price | Title Company |
|---|---|---|---|
| Stephens Jon F | $230,000 | Commonwealth Land Title Co |
Source: Public Records
Mortgage History
| Date | Status | Borrower | Loan Amount |
|---|---|---|---|
| Open | Stephens Jon F | $218,500 |
Source: Public Records
Tax History
| Year | Tax Paid | Tax Assessment Tax Assessment Total Assessment is a certain percentage of the fair market value that is determined by local assessors to be the total taxable value of land and additions on the property. | Land | Improvement |
|---|---|---|---|---|
| 2025 | $4,570 | $346,550 | $158,206 | $188,344 |
| 2024 | $4,379 | $339,755 | $155,104 | $184,651 |
| 2023 | $4,379 | $333,094 | $152,063 | $181,031 |
| 2022 | $4,440 | $326,564 | $149,082 | $177,482 |
| 2021 | $4,439 | $320,161 | $146,159 | $174,002 |
| 2019 | $4,229 | $310,667 | $141,825 | $168,842 |
| 2018 | $4,069 | $304,577 | $139,045 | $165,532 |
| 2017 | $4,042 | $298,606 | $136,319 | $162,287 |
| 2016 | $3,774 | $292,752 | $133,647 | $159,105 |
| 2015 | $3,926 | $288,356 | $131,640 | $156,716 |
| 2014 | $3,803 | $282,709 | $129,062 | $153,647 |
Source: Public Records
Map
Nearby Homes
- 118 Pelican Loop
- 115 Pelican Loop
- 576 Herb White Way
- 126 Halsey Way
- 251 Shoreline Dr
- 88 E 6th St Unit 215
- 161 Edgewater Place
- 311 Shoreline Dr
- 65 Edgewater Place
- 1160 West St
- 80 Loma Vista Way
- 507 Scudero Cir
- 1241 Beacon St
- 310 Central Ave
- 222 Mindy Way
- 254 Mindy Way
- 246 Mindy Way
- 158 E 15th St
- 251 E 17th St
- 3142 Cortina Dr
- 174 Pelican Loop
- 178 Pelican Loop
- 172 Pelican Loop
- 180 Pelican Loop
- 170 Pelican Loop
- 182 Pelican Loop
- 168 Pelican Loop
- 173 Pelican Loop
- 175 Pelican Loop
- 171 Pelican Loop
- 177 Pelican Loop
- 184 Pelican Loop
- 179 Pelican Loop
- 169 Pelican Loop
- 166 Pelican Loop
- 181 Pelican Loop
- 167 Pelican Loop
- 186 Pelican Loop
- 183 Pelican Loop
- 164 Pelican Loop
Your Personal Tour Guide
Ask me questions while you tour the home.