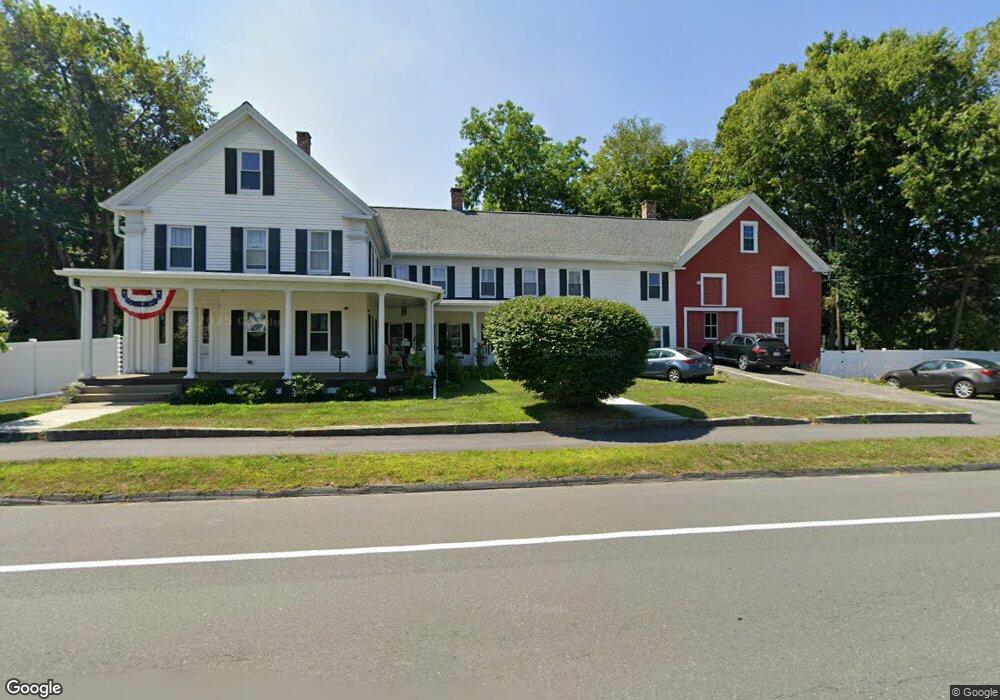
176 S Main St Orange, MA 01364
Estimated Value: $425,000 - $494,000
5
Beds
3
Baths
3,704
Sq Ft
$126/Sq Ft
Est. Value
About This Home
This home is located at 176 S Main St, Orange, MA 01364 and is currently estimated at $465,087, approximately $125 per square foot. 176 S Main St is a home located in Franklin County with nearby schools including Fisher Hill and Ralph C Mahar Regional School.
Ownership History
Date
Name
Owned For
Owner Type
Purchase Details
Closed on
Jun 7, 2024
Sold by
Capuzzo Christopher J and Capuzzo Victor G
Bought by
Capuzzo Victoria D
Current Estimated Value
Purchase Details
Closed on
Jan 24, 2023
Sold by
Capuzzo Victoria D
Bought by
Capuzzo Christopher J and Capuzzo Victor G
Purchase Details
Closed on
Jun 30, 1978
Bought by
Capuzzo Gary L and Capuzzo Victoria D
Create a Home Valuation Report for This Property
The Home Valuation Report is an in-depth analysis detailing your home's value as well as a comparison with similar homes in the area
Home Values in the Area
Average Home Value in this Area
Purchase History
| Date | Buyer | Sale Price | Title Company |
|---|---|---|---|
| Capuzzo Victoria D | -- | None Available | |
| Capuzzo Victoria D | -- | None Available | |
| Capuzzo Christopher J | -- | None Available | |
| Capuzzo Christopher J | -- | None Available | |
| Capuzzo Gary L | $47,000 | -- |
Source: Public Records
Mortgage History
| Date | Status | Borrower | Loan Amount |
|---|---|---|---|
| Previous Owner | Capuzzo Gary L | $185,900 | |
| Previous Owner | Capuzzo Gary L | $66,500 |
Source: Public Records
Tax History
| Year | Tax Paid | Tax Assessment Tax Assessment Total Assessment is a certain percentage of the fair market value that is determined by local assessors to be the total taxable value of land and additions on the property. | Land | Improvement |
|---|---|---|---|---|
| 2025 | $78 | $475,500 | $33,200 | $442,300 |
| 2024 | $7,776 | $445,900 | $33,200 | $412,700 |
| 2023 | $7,498 | $417,500 | $29,800 | $387,700 |
| 2022 | $6,698 | $350,300 | $29,800 | $320,500 |
| 2021 | $6,057 | $302,100 | $48,200 | $253,900 |
| 2020 | $5,808 | $285,700 | $43,900 | $241,800 |
| 2019 | $5,756 | $255,600 | $38,000 | $217,600 |
| 2018 | $5,154 | $234,900 | $35,500 | $199,400 |
| 2017 | $4,987 | $234,900 | $35,500 | $199,400 |
| 2016 | $4,713 | $217,200 | $31,700 | $185,500 |
| 2015 | $4,293 | $206,700 | $33,800 | $172,900 |
| 2014 | $4,424 | $224,100 | $33,800 | $190,300 |
Source: Public Records
Map
Nearby Homes
Your Personal Tour Guide
Ask me questions while you tour the home.