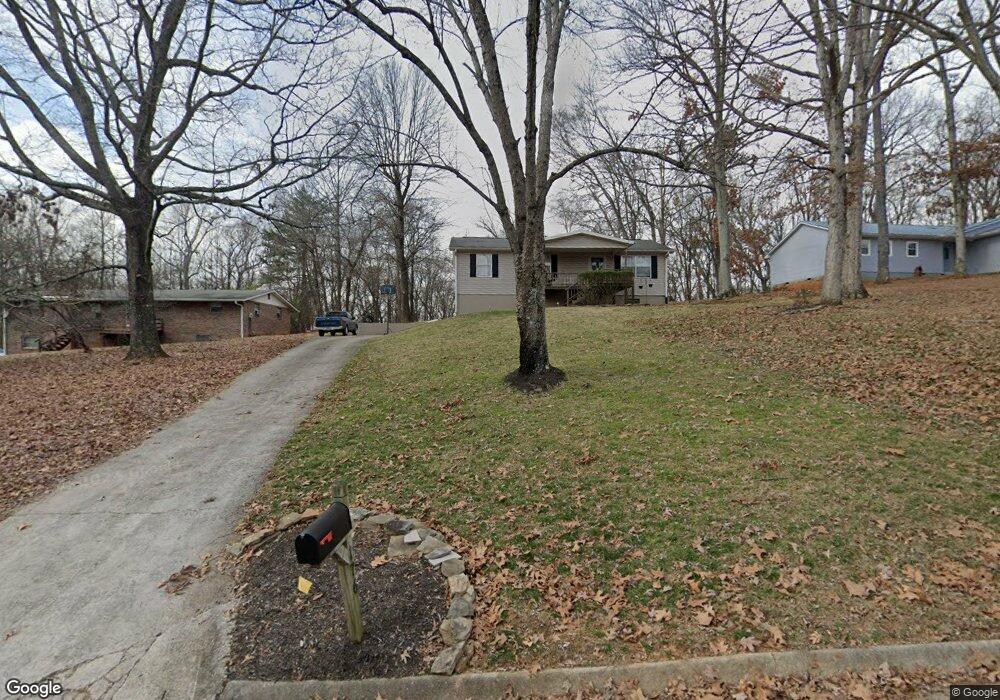
176 Trail View Dr Loudon, TN 37774
Estimated Value: $292,000 - $369,000
--
Bed
3
Baths
1,092
Sq Ft
$289/Sq Ft
Est. Value
About This Home
This home is located at 176 Trail View Dr, Loudon, TN 37774 and is currently estimated at $315,294, approximately $288 per square foot. 176 Trail View Dr is a home located in Loudon County with nearby schools including Loudon High School.
Ownership History
Date
Name
Owned For
Owner Type
Purchase Details
Closed on
Jan 28, 2019
Sold by
Carr Angela D and Mcpherson Angela D
Bought by
Carr Christopher D
Current Estimated Value
Purchase Details
Closed on
Mar 8, 2007
Sold by
Duncan Michael L
Bought by
Carr Christopher D
Home Financials for this Owner
Home Financials are based on the most recent Mortgage that was taken out on this home.
Original Mortgage
$100,000
Interest Rate
6.22%
Purchase Details
Closed on
Nov 15, 2006
Sold by
Washington Mutual Bank
Bought by
Duncan Michael L
Purchase Details
Closed on
Aug 3, 2006
Sold by
Eric Swanson
Bought by
Washington Mutual Bank
Purchase Details
Closed on
Aug 18, 2005
Sold by
Paige Jeremy S
Bought by
Eric Swanson
Purchase Details
Closed on
Oct 18, 2002
Bought by
Paige Jeremy S
Purchase Details
Closed on
Jan 1, 1983
Bought by
Bridges David L and Lou Anne
Create a Home Valuation Report for This Property
The Home Valuation Report is an in-depth analysis detailing your home's value as well as a comparison with similar homes in the area
Home Values in the Area
Average Home Value in this Area
Purchase History
| Date | Buyer | Sale Price | Title Company |
|---|---|---|---|
| Carr Christopher D | -- | Southeastern Title & Abstrac | |
| Carr Christopher D | $127,900 | -- | |
| Duncan Michael L | $65,000 | -- | |
| Washington Mutual Bank | $68,990 | -- | |
| Eric Swanson | $81,000 | -- | |
| Paige Jeremy S | $81,900 | -- | |
| Bridges David L | $38,000 | -- |
Source: Public Records
Mortgage History
| Date | Status | Borrower | Loan Amount |
|---|---|---|---|
| Closed | Bridges David L | $100,000 | |
| Previous Owner | Bridges David L | $52,850 |
Source: Public Records
Tax History Compared to Growth
Tax History
| Year | Tax Paid | Tax Assessment Tax Assessment Total Assessment is a certain percentage of the fair market value that is determined by local assessors to be the total taxable value of land and additions on the property. | Land | Improvement |
|---|---|---|---|---|
| 2025 | $574 | $37,800 | $5,975 | $31,825 |
| 2023 | $574 | $37,800 | $0 | $0 |
| 2022 | $574 | $37,800 | $5,975 | $31,825 |
| 2021 | $574 | $37,800 | $5,975 | $31,825 |
| 2020 | $519 | $37,800 | $5,975 | $31,825 |
| 2019 | $519 | $28,775 | $5,250 | $23,525 |
| 2018 | $519 | $28,775 | $5,250 | $23,525 |
| 2017 | $519 | $28,775 | $5,250 | $23,525 |
| 2016 | $531 | $28,550 | $4,375 | $24,175 |
| 2015 | $531 | $28,550 | $4,375 | $24,175 |
| 2014 | $531 | $28,550 | $4,375 | $24,175 |
Source: Public Records
Map
Nearby Homes
- 171 Trail View Dr
- 161 Trail View Dr
- 219 Cox Rd
- 300 Dailey Ave
- 100 Riverview Dr
- 1106 Freedman St
- 104 Church St
- 119 Upper St
- 305 Church St
- 5750 E Lee Hwy
- 501 Ferry St
- 1429 Grove St
- 400 Collins St
- 506 Wharf St
- 1731 Vonore Rd
- 523 River Bend Dr
- 280 Robinson Trail
- 561 Robinson Dr
- 739 Ferry St
- 2486 Smallen Rd
- 180 Trail View Dr
- 172 Trail View Dr
- 179 Trail View Dr
- 0 Trail View Dr
- 175 Trail View Dr
- 168 Trail View Dr
- 169 Trail View Dr
- 167 Trail View Dr
- 164 Trail View Dr
- 165 Trail View Dr
- 162 Trail View Dr
- 163 Trail View Dr
- 0 Blair Bend Dr
- 150 Trail View Dr
- 142 Trail View Dr
- 221 Cox Rd
- 153 Trail View Dr
- 322 Blair Bend Rd
- 138 Trail View Dr
- 151 Trail View Dr