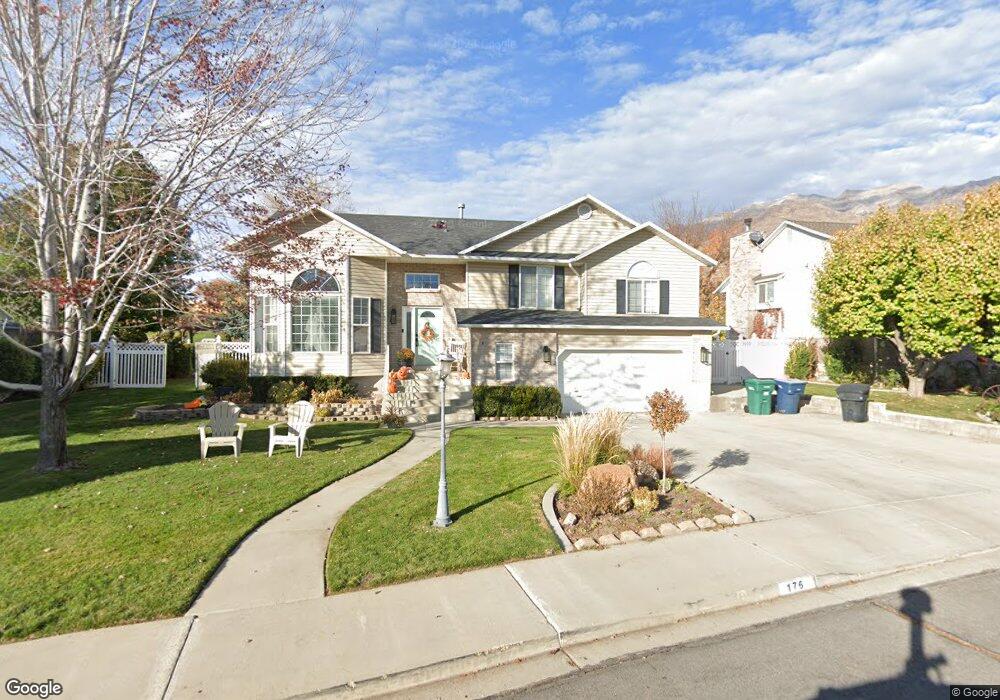
176 W 1820 N Orem, UT 84057
Northridge NeighborhoodEstimated Value: $596,000 - $864,000
5
Beds
3
Baths
2,931
Sq Ft
$231/Sq Ft
Est. Value
About This Home
This home is located at 176 W 1820 N, Orem, UT 84057 and is currently estimated at $676,778, approximately $230 per square foot. 176 W 1820 N is a home located in Utah County with nearby schools including Northridge Elementary School, Oak Canyon Junior High School, and Timpanogos High School.
Ownership History
Date
Name
Owned For
Owner Type
Purchase Details
Closed on
Jan 29, 2026
Sold by
Babb Tyler and Babb Cheryl A
Bought by
Matthews Louisa Tiffany Dens
Current Estimated Value
Home Financials for this Owner
Home Financials are based on the most recent Mortgage that was taken out on this home.
Original Mortgage
$430,000
Outstanding Balance
$430,000
Interest Rate
6.21%
Mortgage Type
New Conventional
Estimated Equity
$246,778
Purchase Details
Closed on
Jan 2, 2020
Sold by
Babb Tyler
Bought by
Babb Tyler and Babb Cheryl A
Home Financials for this Owner
Home Financials are based on the most recent Mortgage that was taken out on this home.
Original Mortgage
$337,000
Interest Rate
3.6%
Mortgage Type
New Conventional
Purchase Details
Closed on
Aug 9, 2013
Sold by
Burhans Margaret Ann and The Margaret Ann Burhans Revoc
Bought by
Babb Tyler and Babb Cheryl A
Home Financials for this Owner
Home Financials are based on the most recent Mortgage that was taken out on this home.
Original Mortgage
$262,200
Interest Rate
4.46%
Mortgage Type
New Conventional
Purchase Details
Closed on
Nov 6, 2003
Sold by
Burhans Margaret Ann
Bought by
Burhans Margaret Ann and The Margaret Ann Burhans Revoc
Create a Home Valuation Report for This Property
The Home Valuation Report is an in-depth analysis detailing your home's value as well as a comparison with similar homes in the area
Home Values in the Area
Average Home Value in this Area
Purchase History
| Date | Buyer | Sale Price | Title Company |
|---|---|---|---|
| Matthews Louisa Tiffany Dens | -- | Chicago Title | |
| Babb Tyler | -- | Utah First Title Ins Agcy | |
| Babb Tyler | -- | Utah First Title Ins Agcy | |
| Babb Tyler | -- | Access Title Company | |
| Burhans Margaret Ann | -- | -- |
Source: Public Records
Mortgage History
| Date | Status | Borrower | Loan Amount |
|---|---|---|---|
| Open | Matthews Louisa Tiffany Dens | $430,000 | |
| Previous Owner | Babb Tyler | $337,000 | |
| Previous Owner | Babb Tyler | $262,200 |
Source: Public Records
Tax History
| Year | Tax Paid | Tax Assessment Tax Assessment Total Assessment is a certain percentage of the fair market value that is determined by local assessors to be the total taxable value of land and additions on the property. | Land | Improvement |
|---|---|---|---|---|
| 2025 | $2,511 | $320,210 | -- | -- |
| 2024 | $2,511 | $307,010 | $0 | $0 |
| 2023 | $2,372 | $311,795 | $0 | $0 |
| 2022 | $2,398 | $305,360 | $0 | $0 |
| 2021 | $2,100 | $404,900 | $175,300 | $229,600 |
| 2020 | $1,927 | $365,300 | $140,200 | $225,100 |
| 2019 | $1,774 | $349,700 | $140,200 | $209,500 |
| 2018 | $1,802 | $339,400 | $132,200 | $207,200 |
| 2017 | $1,632 | $164,670 | $0 | $0 |
| 2016 | $1,553 | $144,485 | $0 | $0 |
| 2015 | $1,627 | $143,165 | $0 | $0 |
| 2014 | $1,527 | $133,760 | $0 | $0 |
Source: Public Records
Map
Nearby Homes
- 49 W 1880 N
- 1744 N 280 W
- 1916 N 430 W
- 92 W 1565 N
- 127 S 400 E
- 1547 N 275 West St Unit 5
- 1566 N 275 West St Unit 1
- 1548 N 275 West St Unit 2
- 1948 N 520 W
- 1638 N 160 E
- 1636 N 160 E
- 14 N 850 E
- 98 S 1025 E
- 1461 N Amiron Way Unit B
- 332 W Amiron Way Unit D
- 287 W 1380 N
- 1545 N State St Unit 1
- 240 E Center St
- 90 S 200 E
- 512 W 1450 N
Your Personal Tour Guide
Ask me questions while you tour the home.