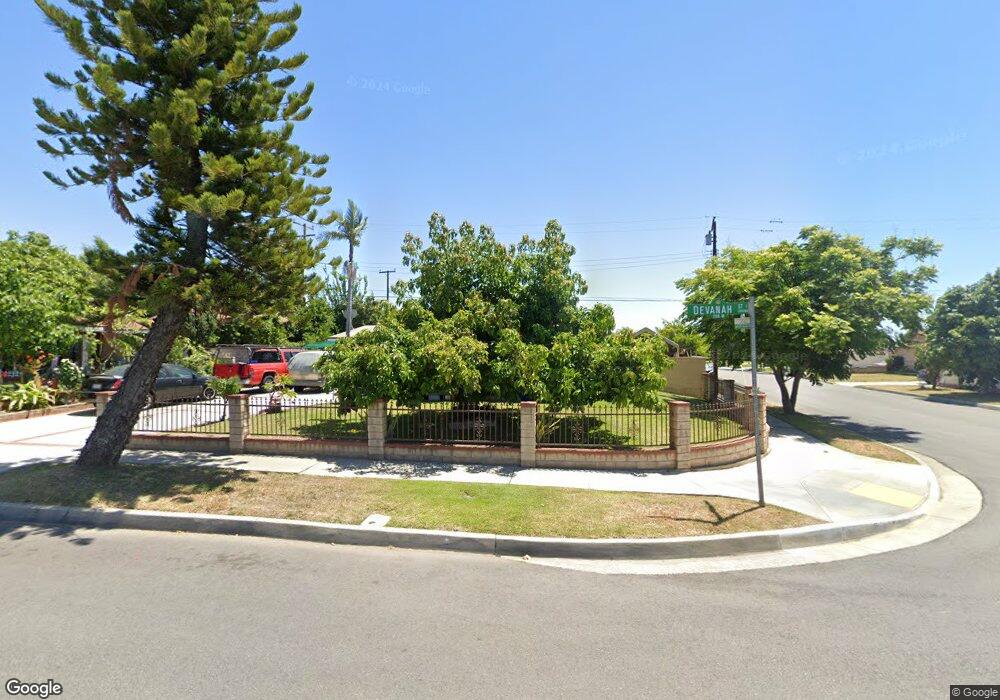
176 W Devanah St Covina, CA 91722
Estimated Value: $613,000 - $759,000
4
Beds
2
Baths
1,125
Sq Ft
$621/Sq Ft
Est. Value
About This Home
This home is located at 176 W Devanah St, Covina, CA 91722 and is currently estimated at $698,973, approximately $621 per square foot. 176 W Devanah St is a home located in Los Angeles County with nearby schools including Cypress Elementary School, Las Palmas Middle School, and Northview High School.
Ownership History
Date
Name
Owned For
Owner Type
Purchase Details
Closed on
Nov 20, 2001
Sold by
Cortes Victor and Garate Mayra
Bought by
Cortes Victor and Cortes Yolanda
Current Estimated Value
Home Financials for this Owner
Home Financials are based on the most recent Mortgage that was taken out on this home.
Original Mortgage
$173,565
Outstanding Balance
$67,388
Interest Rate
6.63%
Estimated Equity
$631,585
Purchase Details
Closed on
Oct 3, 1995
Sold by
Cortes Yolanda
Bought by
Cortes Victor
Home Financials for this Owner
Home Financials are based on the most recent Mortgage that was taken out on this home.
Original Mortgage
$135,901
Interest Rate
7.58%
Mortgage Type
FHA
Purchase Details
Closed on
Sep 25, 1995
Sold by
Roxas John and Roxas Annette C
Bought by
Cortes Victor and Garate Mayraa
Home Financials for this Owner
Home Financials are based on the most recent Mortgage that was taken out on this home.
Original Mortgage
$135,901
Interest Rate
7.58%
Mortgage Type
FHA
Create a Home Valuation Report for This Property
The Home Valuation Report is an in-depth analysis detailing your home's value as well as a comparison with similar homes in the area
Home Values in the Area
Average Home Value in this Area
Purchase History
| Date | Buyer | Sale Price | Title Company |
|---|---|---|---|
| Cortes Victor | -- | Placer Title Company | |
| Cortes Victor | -- | -- | |
| Cortes Victor | $137,500 | -- |
Source: Public Records
Mortgage History
| Date | Status | Borrower | Loan Amount |
|---|---|---|---|
| Open | Cortes Victor | $173,565 | |
| Closed | Cortes Victor | $135,901 |
Source: Public Records
Tax History
| Year | Tax Paid | Tax Assessment Tax Assessment Total Assessment is a certain percentage of the fair market value that is determined by local assessors to be the total taxable value of land and additions on the property. | Land | Improvement |
|---|---|---|---|---|
| 2025 | $3,354 | $254,526 | $162,351 | $92,175 |
| 2024 | $3,354 | $249,536 | $159,168 | $90,368 |
| 2023 | $3,305 | $244,645 | $156,048 | $88,597 |
| 2022 | $3,260 | $239,849 | $152,989 | $86,860 |
| 2021 | $3,209 | $235,147 | $149,990 | $85,157 |
| 2019 | $3,137 | $228,175 | $145,543 | $82,632 |
| 2018 | $2,961 | $223,702 | $142,690 | $81,012 |
| 2016 | $2,798 | $215,017 | $137,150 | $77,867 |
| 2015 | $2,718 | $211,788 | $135,090 | $76,698 |
| 2014 | $2,685 | $207,640 | $132,444 | $75,196 |
Source: Public Records
Map
Nearby Homes
- 218 W Gragmont St
- 1326 N Viceroy Ave
- 1324 N Citrus Ave Unit 12
- 1380 N Citrus Ave Unit H15
- 1380 N Citrus Ave Unit D-10
- 1252 N Citrus Ave Unit 2
- 1234 N Citrus Ave Unit 2
- 1143 Orchard Dr
- 1139 Orchard Dr
- 1178 Taroco Dr
- 125 Dove Landing
- 129 Dove Landing
- 777 S Citrus Ave Unit 232
- 18707 E Arrow Hwy Unit 55
- 18725 E Arrow Hwy Unit 43
- 18725 E Arrow Hwy Unit 40
- 5227 N Fairvalley Ave
- 821 S Cerritos Ave
- 17934 E Laxford Rd
- 17915 E Newburgh St
- 166 W Devanah St
- 1356 N Edenfield Ave
- 212 W Devanah St
- 158 W Devanah St
- 1348 N Edenfield Ave
- 205 W Devanah St
- 1347 N Viceroy Ave
- 1355 N Edenfield Ave
- 165 W Devanah St
- 1355 N Viceroy Ave
- 150 W Devanah St
- 224 W Devanah St
- 211 W Devanah St
- 1340 N Edenfield Ave
- 1347 N Edenfield Ave
- 223 W Devanah St
- 1339 N Viceroy Ave
- 212 W Gragmont St
- 142 W Devanah St
- 230 W Devanah St
Your Personal Tour Guide
Ask me questions while you tour the home.