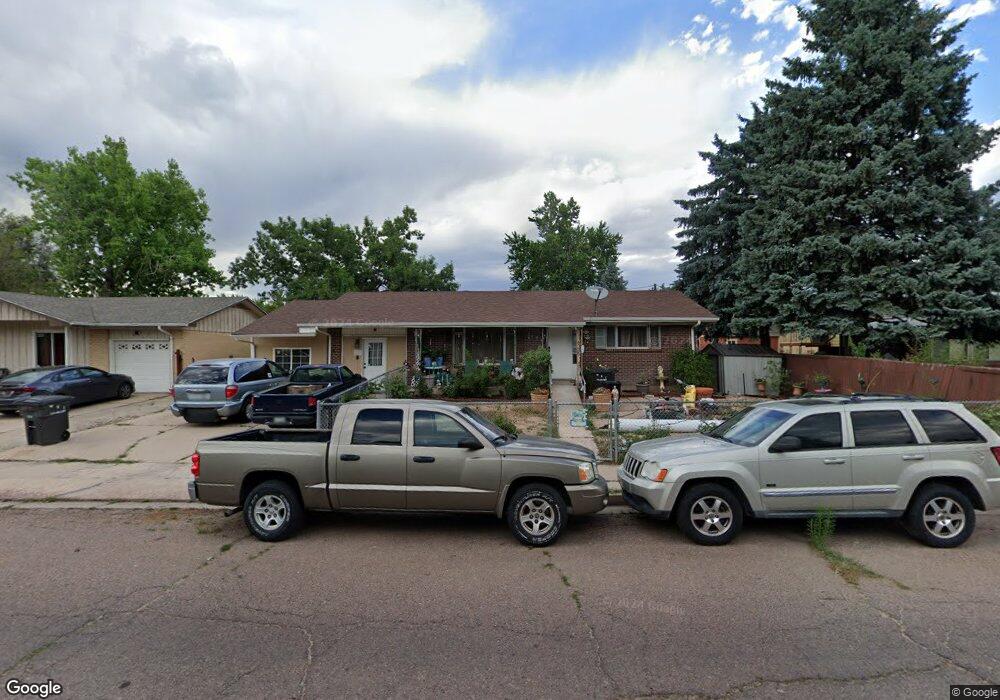
176 Widefield Blvd Colorado Springs, CO 80911
Widefield NeighborhoodEstimated Value: $354,010 - $400,000
5
Beds
3
Baths
1,456
Sq Ft
$257/Sq Ft
Est. Value
About This Home
This home is located at 176 Widefield Blvd, Colorado Springs, CO 80911 and is currently estimated at $374,753, approximately $257 per square foot. 176 Widefield Blvd is a home located in El Paso County with nearby schools including Talbott STEAM Innovation School, Watson Junior High School, and Mesa Ridge High School.
Ownership History
Date
Name
Owned For
Owner Type
Purchase Details
Closed on
Jul 5, 2012
Sold by
Light Jared John
Bought by
Rash Angelika
Current Estimated Value
Home Financials for this Owner
Home Financials are based on the most recent Mortgage that was taken out on this home.
Original Mortgage
$122,171
Outstanding Balance
$86,108
Interest Rate
4.12%
Mortgage Type
FHA
Estimated Equity
$288,645
Purchase Details
Closed on
Feb 28, 2007
Sold by
Stanke Russell L
Bought by
Light Jared John
Home Financials for this Owner
Home Financials are based on the most recent Mortgage that was taken out on this home.
Original Mortgage
$146,500
Interest Rate
6.25%
Mortgage Type
Stand Alone First
Purchase Details
Closed on
Nov 10, 1995
Sold by
Colson Ronald L and Colson Sarah E
Bought by
Stanke Leo C and Stanke Katharyn N
Home Financials for this Owner
Home Financials are based on the most recent Mortgage that was taken out on this home.
Original Mortgage
$99,910
Interest Rate
7.64%
Mortgage Type
VA
Create a Home Valuation Report for This Property
The Home Valuation Report is an in-depth analysis detailing your home's value as well as a comparison with similar homes in the area
Home Values in the Area
Average Home Value in this Area
Purchase History
| Date | Buyer | Sale Price | Title Company |
|---|---|---|---|
| Rash Angelika | $124,425 | Unified Title Company | |
| Light Jared John | $146,500 | Unified Title Company | |
| Stanke Leo C | $98,375 | First American Title |
Source: Public Records
Mortgage History
| Date | Status | Borrower | Loan Amount |
|---|---|---|---|
| Open | Rash Angelika | $122,171 | |
| Previous Owner | Light Jared John | $146,500 | |
| Previous Owner | Stanke Leo C | $99,910 |
Source: Public Records
Tax History Compared to Growth
Tax History
| Year | Tax Paid | Tax Assessment Tax Assessment Total Assessment is a certain percentage of the fair market value that is determined by local assessors to be the total taxable value of land and additions on the property. | Land | Improvement |
|---|---|---|---|---|
| 2025 | $1,674 | $26,640 | -- | -- |
| 2024 | $1,619 | $27,610 | $4,820 | $22,790 |
| 2023 | $1,619 | $27,610 | $4,820 | $22,790 |
| 2022 | $1,350 | $19,360 | $3,410 | $15,950 |
| 2021 | $1,460 | $19,910 | $3,500 | $16,410 |
| 2020 | $1,230 | $16,440 | $3,070 | $13,370 |
| 2019 | $1,222 | $16,440 | $3,070 | $13,370 |
| 2018 | $895 | $11,290 | $2,340 | $8,950 |
| 2017 | $906 | $11,290 | $2,340 | $8,950 |
| 2016 | $698 | $10,820 | $2,390 | $8,430 |
| 2015 | $718 | $10,820 | $2,390 | $8,430 |
| 2014 | $648 | $9,860 | $2,390 | $7,470 |
Source: Public Records
Map
Nearby Homes