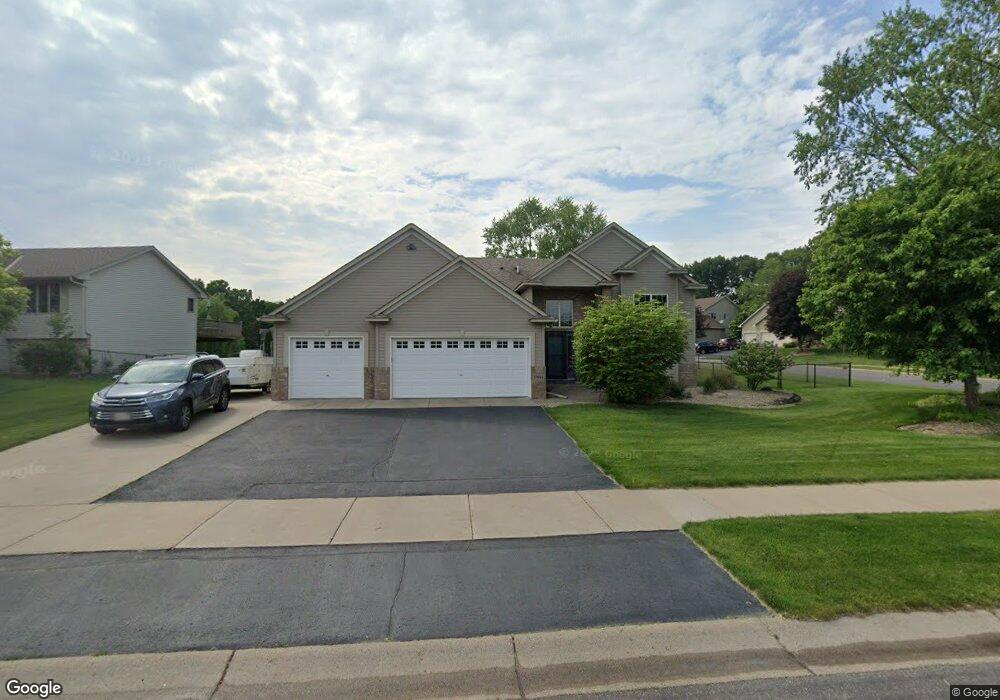
17602 Grant St NW Elk River, MN 55330
Estimated Value: $422,003 - $446,000
4
Beds
3
Baths
2,600
Sq Ft
$167/Sq Ft
Est. Value
About This Home
This home is located at 17602 Grant St NW, Elk River, MN 55330 and is currently estimated at $433,501, approximately $166 per square foot. 17602 Grant St NW is a home located in Sherburne County with nearby schools including Twin Lakes Elementary School, Salk Middle School, and Elk River Senior High School.
Ownership History
Date
Name
Owned For
Owner Type
Purchase Details
Closed on
Aug 28, 2020
Sold by
Engh Kaycie M
Bought by
Gust Anthony and Gust Kelsy
Current Estimated Value
Home Financials for this Owner
Home Financials are based on the most recent Mortgage that was taken out on this home.
Original Mortgage
$269,600
Outstanding Balance
$239,252
Interest Rate
2.9%
Mortgage Type
New Conventional
Estimated Equity
$194,249
Purchase Details
Closed on
May 1, 2019
Sold by
Reimann Shannon
Bought by
Engh Kaycie M
Home Financials for this Owner
Home Financials are based on the most recent Mortgage that was taken out on this home.
Original Mortgage
$281,203
Interest Rate
4%
Mortgage Type
New Conventional
Purchase Details
Closed on
Oct 21, 2004
Sold by
J M Semler Building Corp
Bought by
Reimann Shannon L
Purchase Details
Closed on
Oct 8, 2003
Sold by
Cascade I Land Co Llc
Bought by
J M Semler Building Corp
Create a Home Valuation Report for This Property
The Home Valuation Report is an in-depth analysis detailing your home's value as well as a comparison with similar homes in the area
Home Values in the Area
Average Home Value in this Area
Purchase History
| Date | Buyer | Sale Price | Title Company |
|---|---|---|---|
| Gust Anthony | $337,000 | Lendserv National Title | |
| Engh Kaycie M | $289,900 | Executive Title | |
| Reimann Shannon L | $229,400 | -- | |
| J M Semler Building Corp | $133,800 | -- |
Source: Public Records
Mortgage History
| Date | Status | Borrower | Loan Amount |
|---|---|---|---|
| Open | Gust Anthony | $269,600 | |
| Previous Owner | Engh Kaycie M | $281,203 |
Source: Public Records
Tax History Compared to Growth
Tax History
| Year | Tax Paid | Tax Assessment Tax Assessment Total Assessment is a certain percentage of the fair market value that is determined by local assessors to be the total taxable value of land and additions on the property. | Land | Improvement |
|---|---|---|---|---|
| 2025 | $5,130 | $402,900 | $99,100 | $303,800 |
| 2024 | $4,976 | $397,800 | $99,100 | $298,700 |
| 2023 | $4,936 | $391,900 | $99,100 | $292,800 |
| 2022 | $4,468 | $365,600 | $112,200 | $253,400 |
| 2020 | $4,138 | $268,200 | $67,100 | $201,100 |
| 2019 | $3,526 | $265,200 | $59,300 | $205,900 |
| 2018 | $3,290 | $246,600 | $55,900 | $190,700 |
| 2017 | $3,116 | $223,500 | $52,500 | $171,000 |
| 2016 | $3,096 | $210,800 | $48,300 | $162,500 |
| 2015 | $3,006 | $188,300 | $44,100 | $144,200 |
| 2014 | $2,450 | $177,200 | $41,200 | $136,000 |
| 2013 | -- | $137,800 | $36,000 | $101,800 |
Source: Public Records
Map
Nearby Homes
- 17795 Hoover St NW
- 17726 Hoover St NW
- 17597 Fillmore St NW
- 17750 Hoover St NW
- 10052 177th Cir NW
- 17769 Hoover St NW
- 17774 Hoover St NW
- 17782 Hoover St NW
- 17785 Hoover St NW
- 10300 187th Ave NW
- 10016 178th Ave NW
- 10080 178th Ave NW
- 10096 178th Ave NW
- 10032 178th Ave NW
- 10048 178th Ave NW
- 10022 177th Ave NW
- 10014 177th Ave NW
- 10017 177th Ave NW
- 17720 Lincoln St NW
- 18040 Fillmore Dr NW
- 17588 Grant St NW
- 10082 176th Ave NW
- 17626 Grant St NW
- 10071 176th Ave NW
- 17576 Grant St NW
- 10096 176th Ave NW
- 10085 176th Ave NW
- 17607 Grant St NW
- 17593 Grant St NW
- 17640 Grant St NW
- 10095 175th Ln NW
- 17581 Grant St NW
- 17619 Grant St NW
- 10097 176th Ave NW
- 10110 176th Ave NW
- 17631 Grant St NW
- 17565 Grant Ct NW
- 10105 175th Ln NW
- 17550 Grant Ct NW
- 10086 176th Ln NW