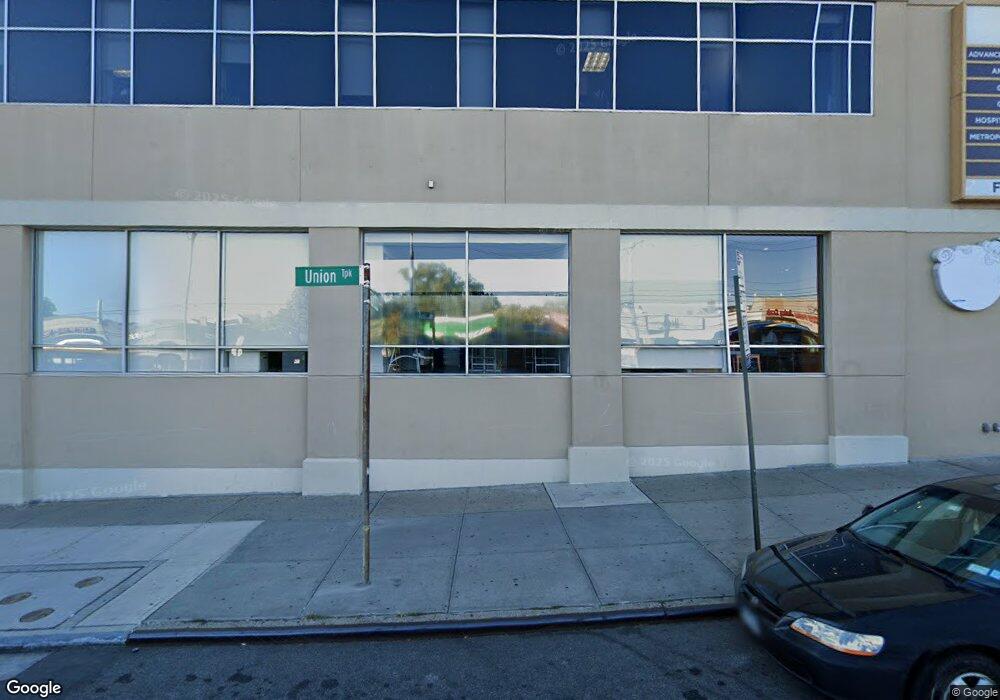
17602 Union Turnpike Flushing, NY 11366
Jamaica Estates NeighborhoodEstimated Value: $7,102,906
--
Bed
--
Bath
2,600
Sq Ft
$2,732/Sq Ft
Est. Value
About This Home
This home is located at 17602 Union Turnpike, Flushing, NY 11366 and is currently estimated at $7,102,906, approximately $2,731 per square foot. 17602 Union Turnpike is a home located in Queens County with nearby schools including P.S. 131 - Abigail Adams, George J. Ryan Middle School 216, and Holy Family School.
Ownership History
Date
Name
Owned For
Owner Type
Purchase Details
Closed on
Mar 19, 2014
Sold by
Cumberland Farms Inc
Bought by
Mukti 17802 Llc
Current Estimated Value
Home Financials for this Owner
Home Financials are based on the most recent Mortgage that was taken out on this home.
Original Mortgage
$3,160,000
Outstanding Balance
$2,374,594
Interest Rate
4.27%
Mortgage Type
Commercial
Estimated Equity
$4,728,312
Purchase Details
Closed on
Sep 10, 2003
Sold by
Bny Western Trust Company
Bought by
Cumberland Farms Inc
Purchase Details
Closed on
Feb 3, 2000
Sold by
Exxon Mobil Corp
Bought by
Bny Western Trust Company and Tosco Trust 2000-E
Create a Home Valuation Report for This Property
The Home Valuation Report is an in-depth analysis detailing your home's value as well as a comparison with similar homes in the area
Home Values in the Area
Average Home Value in this Area
Purchase History
| Date | Buyer | Sale Price | Title Company |
|---|---|---|---|
| Mukti 17802 Llc | $4,500,000 | -- | |
| Mukti 17802 Llc | $4,500,000 | -- | |
| Cumberland Farms Inc | $477,270 | -- | |
| Cumberland Farms Inc | $477,270 | -- | |
| Bny Western Trust Company | $1,267,000 | First American | |
| Bny Western Trust Company | $1,267,000 | First American |
Source: Public Records
Mortgage History
| Date | Status | Borrower | Loan Amount |
|---|---|---|---|
| Open | Mukti 17802 Llc | $3,160,000 | |
| Closed | Mukti 17802 Llc | $3,160,000 |
Source: Public Records
Tax History Compared to Growth
Tax History
| Year | Tax Paid | Tax Assessment Tax Assessment Total Assessment is a certain percentage of the fair market value that is determined by local assessors to be the total taxable value of land and additions on the property. | Land | Improvement |
|---|---|---|---|---|
| 2025 | $98,048 | $997,500 | $481,950 | $515,550 |
| 2024 | $98,048 | $925,680 | $481,950 | $443,730 |
| 2023 | $91,988 | $868,470 | $481,950 | $386,520 |
| 2022 | $53,429 | $958,500 | $481,950 | $476,550 |
| 2021 | $82,341 | $905,850 | $481,950 | $423,900 |
| 2020 | $78,609 | $905,850 | $481,950 | $423,900 |
| 2019 | $77,352 | $857,700 | $481,950 | $375,750 |
| 2018 | $75,123 | $714,509 | $481,950 | $232,559 |
| 2017 | $73,534 | $699,389 | $481,950 | $217,439 |
| 2016 | $71,051 | $699,389 | $481,950 | $217,439 |
| 2015 | $30,101 | $649,259 | $479,160 | $170,099 |
| 2014 | $30,101 | $633,779 | $476,370 | $157,409 |
Source: Public Records
Map
Nearby Homes
- 179-04 80th Dr
- 7562 177th St
- 75-84 180th St
- 75-82 177 Street 177th St
- 76-27 175th St
- 7516 180th St
- 67 182nd St
- 75-31 175th St
- 181-30 Tudor Rd
- 8177 Utopia Pkwy
- 17624 Kildare Rd
- 7662 174th St
- 7610 174th St
- 7318 180th St
- 75-56 184th St
- 7615 172nd St
- 75-10 173rd St
- 184-46 Aberdeen Rd
- 171-06 76th Ave
- 6967 181st St
- 17653 80th Rd
- 17649 80th Rd
- 17657 80th Rd
- 80-10 Surrey Place
- 8008 Surrey Place
- 176-53 80th Rd
- 80-08 Surrey Place
- 80-08 Surrey Place Unit 1
- 17645 80th Rd
- 80-12 Surrey Place
- 17663 80th Rd
- 178-01 Union Turnpike
- 17807 Union Turnpike
- 17641 80th Rd
- 17667 80th Rd
- 177-15 Union Turnpike
- 17637 80th Rd
- 17671 80th Rd
- 17713 Union Turnpike
- 177-07 Union Turnpike