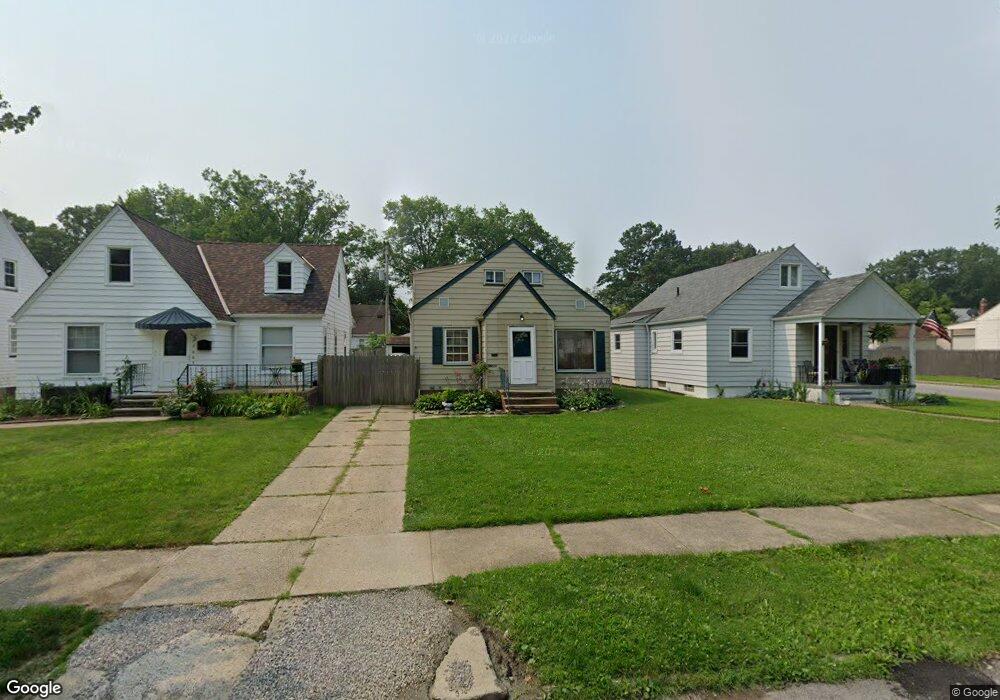
17609 Flamingo Ave Cleveland, OH 44135
Riverside NeighborhoodEstimated Value: $156,000 - $185,000
3
Beds
1
Bath
1,264
Sq Ft
$137/Sq Ft
Est. Value
About This Home
This home is located at 17609 Flamingo Ave, Cleveland, OH 44135 and is currently estimated at $173,670, approximately $137 per square foot. 17609 Flamingo Ave is a home located in Cuyahoga County with nearby schools including Artemus Ward School, Almira Academy, and Benjamin Franklin.
Ownership History
Date
Name
Owned For
Owner Type
Purchase Details
Closed on
Jun 23, 2022
Sold by
Torres Jomar and Torres Katherine Arroyo
Bought by
Khadige George J and Khadige Joseph J
Current Estimated Value
Purchase Details
Closed on
Nov 9, 2010
Sold by
Thomas George P and Thomas Mary J
Bought by
Torres Jomar and Arroyo Katherine
Purchase Details
Closed on
Feb 3, 2009
Sold by
Secretary Of Housing & Urban Development
Bought by
Thomas George P
Purchase Details
Closed on
Jul 6, 2007
Sold by
Eging Mary C
Bought by
Hud
Purchase Details
Closed on
Nov 16, 1999
Sold by
Kaiser John A and Kaiser Alice L
Bought by
Eging Mary C
Home Financials for this Owner
Home Financials are based on the most recent Mortgage that was taken out on this home.
Original Mortgage
$81,442
Interest Rate
7.88%
Mortgage Type
FHA
Purchase Details
Closed on
Mar 8, 1983
Sold by
Kowell Gary A
Bought by
Kaiser John A and Kaiser Alice L
Purchase Details
Closed on
Mar 2, 1979
Sold by
Horlacher Betty J
Bought by
Kowell Gary A
Purchase Details
Closed on
Jan 1, 1975
Bought by
Horlacher Betty J
Create a Home Valuation Report for This Property
The Home Valuation Report is an in-depth analysis detailing your home's value as well as a comparison with similar homes in the area
Home Values in the Area
Average Home Value in this Area
Purchase History
| Date | Buyer | Sale Price | Title Company |
|---|---|---|---|
| Khadige George J | $50,000 | Terra Blue Title | |
| Torres Jomar | $34,500 | Chicago Title Insurance Co | |
| Thomas George P | $15,000 | Lakeside Title | |
| Hud | $50,000 | Attorney | |
| Eging Mary C | $81,500 | Transcounty Title Agency Inc | |
| Kaiser John A | $41,000 | -- | |
| Kowell Gary A | $39,000 | -- | |
| Horlacher Betty J | -- | -- |
Source: Public Records
Mortgage History
| Date | Status | Borrower | Loan Amount |
|---|---|---|---|
| Previous Owner | Eging Mary C | $81,442 |
Source: Public Records
Tax History Compared to Growth
Tax History
| Year | Tax Paid | Tax Assessment Tax Assessment Total Assessment is a certain percentage of the fair market value that is determined by local assessors to be the total taxable value of land and additions on the property. | Land | Improvement |
|---|---|---|---|---|
| 2024 | $2,994 | $44,765 | $7,560 | $37,205 |
| 2023 | $2,374 | $30,630 | $6,270 | $24,360 |
| 2022 | $2,310 | $30,630 | $6,270 | $24,360 |
| 2021 | $1,633 | $30,630 | $6,270 | $24,360 |
| 2020 | $1,279 | $23,560 | $4,830 | $18,730 |
| 2019 | $1,183 | $67,300 | $13,800 | $53,500 |
| 2018 | $725 | $23,560 | $4,830 | $18,730 |
| 2017 | $275 | $12,080 | $4,200 | $7,880 |
| 2016 | $1,806 | $12,080 | $4,200 | $7,880 |
| 2015 | $3,495 | $12,080 | $4,200 | $7,880 |
| 2014 | $3,495 | $12,080 | $4,200 | $7,880 |
Source: Public Records
Map
Nearby Homes
- 17500 Fairville Ave
- 4541 W 174th St
- 17422 Puritas Ave
- 17201 Martha Rd
- 4492 W 170th St
- 4413 W 173rd St
- 4494 Rocky River Dr
- 18018 Ridgeline Ave
- 18320 Ponciana Ave
- 17408 Elsienna Ave
- 4352 W 182nd St
- 18309 Rockland Ave
- 16701 Elsienna Ave
- 16312 Laverne Ave
- 4515 W 158th St
- 4374 W 187th St
- 16936 Woodbury Ave
- 18614 Homeway Rd
- 4267 W 162nd St
- 4368 W 189th St
- 17613 Flamingo Ave
- 17605 Flamingo Ave
- 17601 Flamingo Ave
- 17608 Ponciana Ave
- 17701 Flamingo Ave
- 17612 Ponciana Ave
- 17513 Flamingo Ave
- 17604 Ponciana Ave
- 17600 Ponciana Ave
- 17705 Flamingo Ave
- 17509 Flamingo Ave
- 17608 Flamingo Ave
- 17702 Ponciana Ave
- 17512 Ponciana Ave
- 17612 Flamingo Ave
- 17604 Flamingo Ave
- 17600 Flamingo Ave
- 17706 Ponciana Ave
- 17508 Ponciana Ave
- 17709 Flamingo Ave