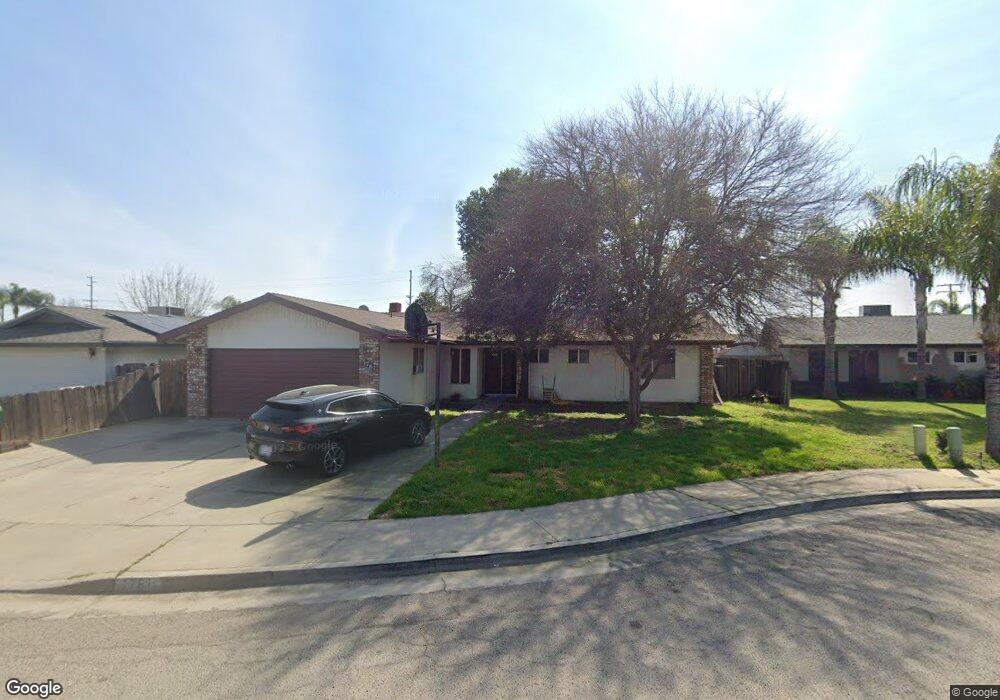
1761 Mccomb Ave Porterville, CA 93257
Porterville Northwest NeighborhoodEstimated Value: $307,579 - $334,000
3
Beds
2
Baths
1,274
Sq Ft
$253/Sq Ft
Est. Value
About This Home
This home is located at 1761 Mccomb Ave, Porterville, CA 93257 and is currently estimated at $322,645, approximately $253 per square foot. 1761 Mccomb Ave is a home located in Tulare County with nearby schools including Oak Grove Elementary School, Burton Middle School, and Monache High School.
Ownership History
Date
Name
Owned For
Owner Type
Purchase Details
Closed on
Mar 27, 2019
Sold by
Rayani Hussain
Bought by
Silva Rayani Hussain and Silva Scott Adriana
Current Estimated Value
Home Financials for this Owner
Home Financials are based on the most recent Mortgage that was taken out on this home.
Original Mortgage
$142,500
Outstanding Balance
$125,283
Interest Rate
4.3%
Mortgage Type
New Conventional
Estimated Equity
$197,362
Purchase Details
Closed on
Oct 14, 2008
Sold by
Us Bank Na
Bought by
Silva Adriana
Purchase Details
Closed on
Sep 2, 2008
Sold by
Dekker Willy
Bought by
U S Bank Na
Purchase Details
Closed on
Jul 13, 1994
Sold by
Lockhart Irvin R
Bought by
Dekker Willy and Dekker Carrie D
Home Financials for this Owner
Home Financials are based on the most recent Mortgage that was taken out on this home.
Original Mortgage
$81,697
Interest Rate
8.65%
Mortgage Type
FHA
Create a Home Valuation Report for This Property
The Home Valuation Report is an in-depth analysis detailing your home's value as well as a comparison with similar homes in the area
Home Values in the Area
Average Home Value in this Area
Purchase History
| Date | Buyer | Sale Price | Title Company |
|---|---|---|---|
| Silva Rayani Hussain | -- | First American Title Company | |
| Silva Adriana | $98,500 | First American Title Company | |
| U S Bank Na | $140,250 | First American Title Company | |
| Dekker Willy | $82,000 | Chicago Title Company |
Source: Public Records
Mortgage History
| Date | Status | Borrower | Loan Amount |
|---|---|---|---|
| Open | Silva Rayani Hussain | $142,500 | |
| Previous Owner | Dekker Willy | $81,697 |
Source: Public Records
Tax History Compared to Growth
Tax History
| Year | Tax Paid | Tax Assessment Tax Assessment Total Assessment is a certain percentage of the fair market value that is determined by local assessors to be the total taxable value of land and additions on the property. | Land | Improvement |
|---|---|---|---|---|
| 2025 | $1,333 | $126,840 | $64,386 | $62,454 |
| 2024 | $1,333 | $124,354 | $63,124 | $61,230 |
| 2023 | $1,336 | $121,917 | $61,887 | $60,030 |
| 2022 | $1,285 | $119,527 | $60,674 | $58,853 |
| 2021 | $1,265 | $117,183 | $59,484 | $57,699 |
| 2020 | $1,242 | $115,981 | $58,874 | $57,107 |
| 2019 | $1,241 | $113,707 | $57,720 | $55,987 |
| 2018 | $1,186 | $111,477 | $56,588 | $54,889 |
| 2017 | $1,167 | $109,291 | $55,478 | $53,813 |
| 2016 | $1,112 | $107,148 | $54,390 | $52,758 |
| 2015 | $1,073 | $105,539 | $53,573 | $51,966 |
| 2014 | $1,073 | $103,472 | $52,524 | $50,948 |
Source: Public Records
Map
Nearby Homes
- 1644 Mccomb Ave
- 1750 W Terry Cir
- 1691 Terry Ct
- 1690 Memory Ln
- 1730 W Grand Ave
- 595 N Salisbury St
- 1041 Greenfield Dr
- 1681 W Wall Ln
- 1771 W Aurora Ct
- 1857 W Westfield Ave
- 1076 N Beverly St
- 1926 W Nancy Ave
- 1121 N Lindale Way
- 2070 W Harrison Ave
- 2164 W San Lucia Ct
- 1045 N Westside St
- 313 Balmoral Dr
- 0 Pioneer Ave Unit 233651
- 700 N Prospect St
- Sydney Plan at Laurelwood
- 1751 Mccomb Ave
- 1771 Mccomb Ave
- 1760 W Henderson Ave
- 1741 Mccomb Ave
- 1750 W Henderson Ave
- 1770 W Henderson Ave
- 841 Salisbury St
- 1741 Mccomb Ave
- 850 Salisbury St
- 851 Salisbury St
- 1780 W Henderson Ave
- 850 N Salisbury St
- 1740 W Henderson Ave
- 1731 Mccomb Ave
- 1740 Mccomb Ave
- 1740 Mccomb Ave
- 861 Salisbury St
- 1730 W Henderson Ave
- 832 N Belmont St
- 860 Salisbury St