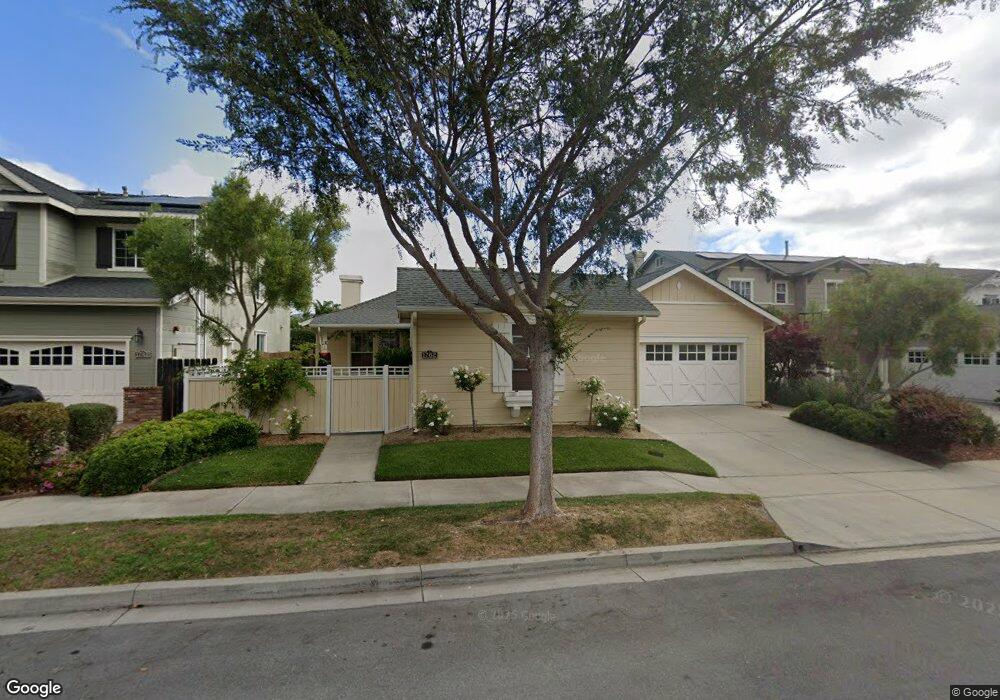
1762 Devaul Ranch Dr San Luis Obispo, CA 93405
Estimated Value: $1,086,000 - $1,636,000
4
Beds
3
Baths
2,075
Sq Ft
$608/Sq Ft
Est. Value
About This Home
This home is located at 1762 Devaul Ranch Dr, San Luis Obispo, CA 93405 and is currently estimated at $1,261,261, approximately $607 per square foot. 1762 Devaul Ranch Dr is a home located in San Luis Obispo County with nearby schools including C.L. Smith Elementary School, Laguna Middle School, and San Luis Obispo High School.
Ownership History
Date
Name
Owned For
Owner Type
Purchase Details
Closed on
Jul 22, 2022
Sold by
John Sawyer Douglas and John Elaine Jennifer
Bought by
D And J Sawyer Living Trust
Current Estimated Value
Home Financials for this Owner
Home Financials are based on the most recent Mortgage that was taken out on this home.
Original Mortgage
$200,000
Outstanding Balance
$187,558
Interest Rate
5.81%
Mortgage Type
Credit Line Revolving
Estimated Equity
$1,073,703
Purchase Details
Closed on
Jan 23, 2021
Sold by
Sawyer Douglas John and Sawyer Jennifer Elaine
Bought by
Sawyer Douglas John and Sawyer Jennifer Elaine
Purchase Details
Closed on
Nov 18, 2003
Sold by
Slo Estates Inc
Bought by
Sawyer Douglas John and Sawyer Jennifer Elaine
Home Financials for this Owner
Home Financials are based on the most recent Mortgage that was taken out on this home.
Original Mortgage
$401,660
Interest Rate
6.04%
Mortgage Type
Purchase Money Mortgage
Create a Home Valuation Report for This Property
The Home Valuation Report is an in-depth analysis detailing your home's value as well as a comparison with similar homes in the area
Home Values in the Area
Average Home Value in this Area
Purchase History
| Date | Buyer | Sale Price | Title Company |
|---|---|---|---|
| D And J Sawyer Living Trust | -- | None Listed On Document | |
| Sawyer Douglas John | -- | Fidelity National Title | |
| Sawyer Douglas John | -- | None Available | |
| Sawyer Douglas John | -- | None Available | |
| Sawyer Douglas John | $574,000 | First American Title Company |
Source: Public Records
Mortgage History
| Date | Status | Borrower | Loan Amount |
|---|---|---|---|
| Open | Sawyer Douglas John | $200,000 | |
| Previous Owner | Sawyer Douglas John | $401,660 |
Source: Public Records
Tax History Compared to Growth
Tax History
| Year | Tax Paid | Tax Assessment Tax Assessment Total Assessment is a certain percentage of the fair market value that is determined by local assessors to be the total taxable value of land and additions on the property. | Land | Improvement |
|---|---|---|---|---|
| 2025 | $8,762 | $815,802 | $341,219 | $474,583 |
| 2024 | $8,602 | $799,807 | $334,529 | $465,278 |
| 2023 | $8,602 | $784,125 | $327,970 | $456,155 |
| 2022 | $8,061 | $768,751 | $321,540 | $447,211 |
| 2021 | $7,932 | $753,679 | $315,236 | $438,443 |
| 2020 | $7,850 | $745,952 | $312,004 | $433,948 |
| 2019 | $7,767 | $731,327 | $305,887 | $425,440 |
| 2018 | $7,613 | $716,989 | $299,890 | $417,099 |
| 2017 | $7,462 | $702,931 | $294,010 | $408,921 |
| 2016 | $7,314 | $689,149 | $288,246 | $400,903 |
| 2015 | $7,202 | $678,799 | $283,917 | $394,882 |
| 2014 | $6,611 | $665,503 | $278,356 | $387,147 |
Source: Public Records
Map
Nearby Homes
- 1963 Devaul Ranch Dr
- 11295 Los Osos Valley Rd Unit 14
- 1845 Thelma Dr Unit 59
- 1020 Ilene Dr
- 1809 Thelma Dr Unit 50
- 915 Madonna Rd Unit 102
- 1466 Balboa St
- 1556 Gulf St
- 905 Madonna Rd Unit 79
- 932 Legacy Ln
- 1129 Vista Del Lago
- 908 Legacy Ln
- 1929 San Luis Ranch Rd
- 1545 Descanso St
- 967 Capistrano Ct
- 897 Isabella Way
- 2040 Prado Rd
- 3960 S Higuera St Unit 79
- 3960 S Higuera St Unit 14
- 56 Los Verdes Dr
- 1742 Devaul Ranch Dr
- 1782 Devaul Ranch Dr
- 1765 Spooner Dr
- 1749 Spooner Dr
- 1781 Spooner Dr
- 1788 Devaul Ranch Dr
- 1733 Spooner Dr
- 1761 Devaul Ranch Dr
- 1741 Devaul Ranch Dr
- 1702 Devaul Ranch Dr
- 1781 Devaul Ranch Dr
- 1721 Devaul Ranch Dr
- 1717 Spooner Dr
- 1801 Devaul Ranch Dr
- 1682 Devaul Ranch Dr
- 1701 Devaul Ranch Dr
- 1703 Spooner Dr
- 1724 Spooner Dr
- 1800 Spooner Dr
- 1864 Spooner Dr