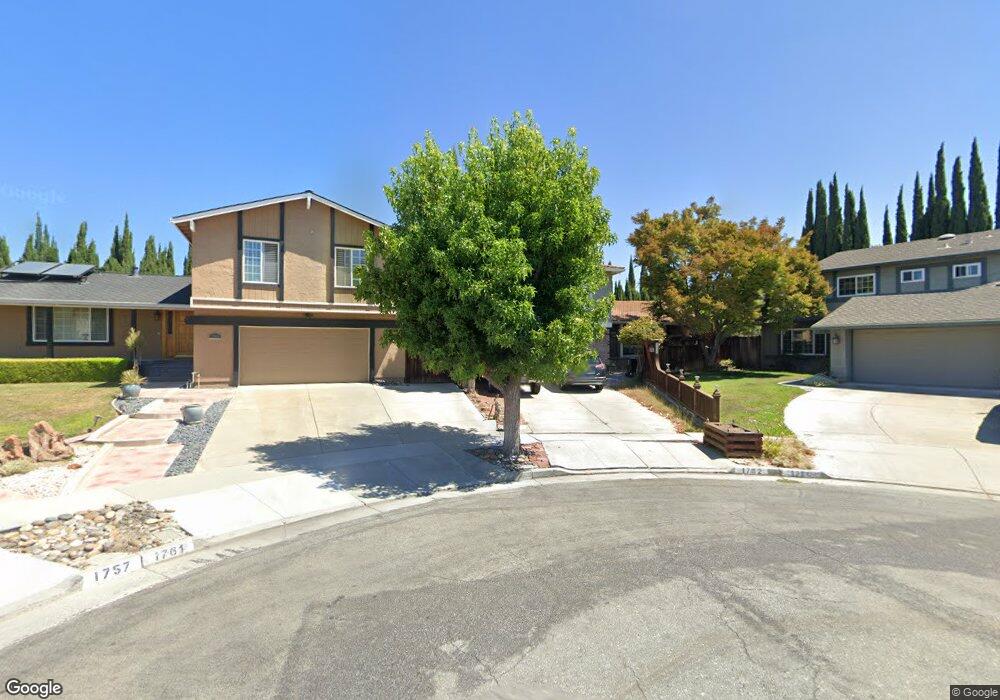
1762 Maysong Ct San Jose, CA 95131
Vinci South NeighborhoodEstimated Value: $1,607,000 - $1,738,000
4
Beds
3
Baths
2,124
Sq Ft
$786/Sq Ft
Est. Value
About This Home
This home is located at 1762 Maysong Ct, San Jose, CA 95131 and is currently estimated at $1,669,468, approximately $786 per square foot. 1762 Maysong Ct is a home located in Santa Clara County with nearby schools including Vinci Park Elementary School, Morrill Middle School, and Independence High School.
Ownership History
Date
Name
Owned For
Owner Type
Purchase Details
Closed on
Sep 14, 2021
Sold by
Taylor John Frank
Bought by
Taylor John F and John F Taylor Revocable Trust
Current Estimated Value
Purchase Details
Closed on
Jan 13, 2020
Sold by
Taylor John Frank and Estate Of John M Taylor
Bought by
Taylor John Frank
Purchase Details
Closed on
Feb 23, 2005
Sold by
Taylor John M and Taylor Teresa D
Bought by
Taylor John Morrison
Create a Home Valuation Report for This Property
The Home Valuation Report is an in-depth analysis detailing your home's value as well as a comparison with similar homes in the area
Home Values in the Area
Average Home Value in this Area
Purchase History
| Date | Buyer | Sale Price | Title Company |
|---|---|---|---|
| Taylor John F | -- | None Available | |
| Taylor John Frank | -- | None Available | |
| Taylor John Morrison | -- | -- |
Source: Public Records
Tax History Compared to Growth
Tax History
| Year | Tax Paid | Tax Assessment Tax Assessment Total Assessment is a certain percentage of the fair market value that is determined by local assessors to be the total taxable value of land and additions on the property. | Land | Improvement |
|---|---|---|---|---|
| 2025 | $2,852 | $108,749 | $24,454 | $84,295 |
| 2024 | $2,852 | $106,618 | $23,975 | $82,643 |
| 2023 | $2,757 | $104,528 | $23,505 | $81,023 |
| 2022 | $2,731 | $102,480 | $23,045 | $79,435 |
| 2021 | $2,602 | $100,472 | $22,594 | $77,878 |
| 2020 | $2,487 | $99,443 | $22,363 | $77,080 |
| 2019 | $2,384 | $97,494 | $21,925 | $75,569 |
| 2018 | $2,332 | $95,584 | $21,496 | $74,088 |
| 2017 | $2,252 | $93,711 | $21,075 | $72,636 |
| 2016 | $2,151 | $91,874 | $20,662 | $71,212 |
| 2015 | $2,175 | $90,495 | $20,352 | $70,143 |
| 2014 | $1,723 | $88,723 | $19,954 | $68,769 |
Source: Public Records
Map
Nearby Homes
- 1809 Sageland Dr
- 1210 Briarcreek Ct
- 1146 Rosebriar Way
- 2044 Voss Park Ln
- 1713 Winston St
- 1049 Branbury Way
- 1968 Nutmeg Ct
- 1337 Araujo St
- 1087 Yarrow Terrace
- 1767 Clove Ct
- 1137 Mallow Terrace
- 1055 Thyme Walkway
- 1660 Solari Place
- 1233 Briarleaf Cir
- 2064 Wizard Ct
- 1997 Lowney Way
- 1027 Giacomo Ln Unit 7
- 2109 Kiwi Walkway
- 1441 Rocklin Ct Unit 112
- 1036 Onofrio Ln Unit 6
- 1760 Maysong Ct
- 1761 Maysong Ct
- 1729 Seville Way
- 1725 Seville Way
- 1731 Seville Way
- 1763 Aprilsong Ct
- 1756 Maysong Ct
- 1723 Seville Way
- 1757 Maysong Ct
- 1767 Aprilsong Ct
- 1735 Seville Way
- 1759 Aprilsong Ct
- 1752 Maysong Ct
- 1753 Maysong Ct
- 1721 Seville Way
- 1737 Seville Way
- 1755 Aprilsong Ct
- 1754 Septembersong Ct
- 1748 Maysong Ct
- 1749 Maysong Ct