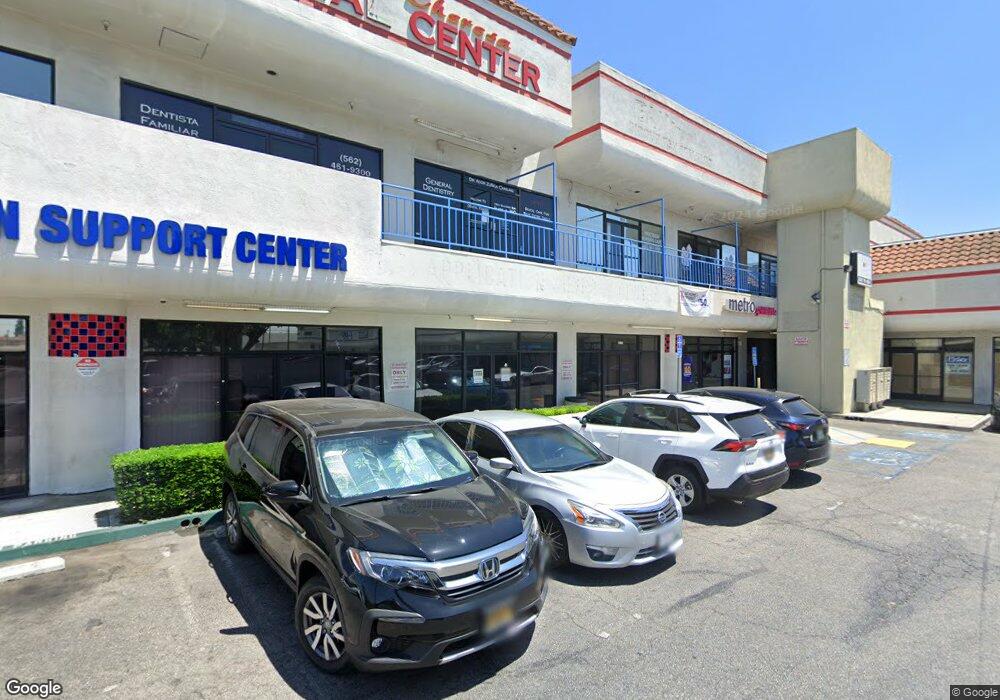
17620 Bellflower Blvd Unit 111 Bellflower, CA 90706
--
Bed
--
Bath
12,338
Sq Ft
0.97
Acres
About This Home
This home is located at 17620 Bellflower Blvd Unit 111, Bellflower, CA 90706. 17620 Bellflower Blvd Unit 111 is a home located in Los Angeles County with nearby schools including Thomas Jefferson Elementary School, Mayfair High School, and St. Bernard School.
Ownership History
Date
Name
Owned For
Owner Type
Purchase Details
Closed on
Jan 30, 2015
Sold by
Christina Enterprises Bellflower Llc
Bought by
Bellflower First Plaza Llc
Purchase Details
Closed on
Mar 28, 2011
Sold by
Christina Enterprises Llc
Bought by
Christina Enterprises Bellflower Llc
Purchase Details
Closed on
Mar 18, 2005
Sold by
Armony Ronen and Armony Joanne
Bought by
Ghanimian Viken
Home Financials for this Owner
Home Financials are based on the most recent Mortgage that was taken out on this home.
Original Mortgage
$6,125,000
Interest Rate
5.53%
Mortgage Type
Commercial
Purchase Details
Closed on
Mar 16, 2005
Sold by
Ghanimian Pauline
Bought by
Ghanimian Viken
Home Financials for this Owner
Home Financials are based on the most recent Mortgage that was taken out on this home.
Original Mortgage
$6,125,000
Interest Rate
5.53%
Mortgage Type
Commercial
Create a Home Valuation Report for This Property
The Home Valuation Report is an in-depth analysis detailing your home's value as well as a comparison with similar homes in the area
Home Values in the Area
Average Home Value in this Area
Purchase History
| Date | Buyer | Sale Price | Title Company |
|---|---|---|---|
| Bellflower First Plaza Llc | $9,275,000 | Chicago Title Company | |
| Christina Enterprises Bellflower Llc | -- | Fidelity National Title Co | |
| Ghanimian Viken | $8,750,000 | Ltc | |
| Ghanimian Viken | -- | Ltc | |
| Ghanimian Ghahe | -- | Ltc |
Source: Public Records
Mortgage History
| Date | Status | Borrower | Loan Amount |
|---|---|---|---|
| Previous Owner | Ghanimian Viken | $6,125,000 |
Source: Public Records
Tax History Compared to Growth
Tax History
| Year | Tax Paid | Tax Assessment Tax Assessment Total Assessment is a certain percentage of the fair market value that is determined by local assessors to be the total taxable value of land and additions on the property. | Land | Improvement |
|---|---|---|---|---|
| 2025 | $48,867 | $3,755,772 | $2,103,233 | $1,652,539 |
| 2024 | $48,867 | $3,682,131 | $2,061,994 | $1,620,137 |
| 2023 | $46,969 | $3,609,933 | $2,021,563 | $1,588,370 |
| 2022 | $46,137 | $3,539,151 | $1,981,925 | $1,557,226 |
| 2021 | $45,169 | $3,469,757 | $1,943,064 | $1,526,693 |
| 2019 | $44,011 | $3,366,844 | $1,885,433 | $1,481,411 |
| 2018 | $42,271 | $3,300,828 | $1,848,464 | $1,452,364 |
| 2016 | $40,543 | $3,172,655 | $1,776,687 | $1,395,968 |
| 2015 | $41,013 | $3,247,462 | $1,681,722 | $1,565,740 |
| 2014 | -- | $3,183,850 | $1,648,780 | $1,535,070 |
Source: Public Records
Map
Nearby Homes
- 9713 Cedar St
- 9928 Cedar St
- 9924 Cedar St
- 5549 Ashworth St
- 9833 Palm St
- 6168 Briercrest Ave
- 9513 Cedar St
- 6118 Amos Ave
- 6127 Adenmoor Ave
- 9929 Park St
- 10117 Palm St
- 10240 Artesia Blvd
- 17625 Carpintero Ave Unit 62
- 5134 Ashworth St
- 9833 Walnut St
- 17641 Windward Terrace
- 6157 Carpintero Ave
- 16821 Ardmore Ave
- 17046 Clark Ave
- 9253 Rose St
- 17620 Bellflower Blvd Unit B108
- 17640 Bellflower Blvd
- 17634 Bellflower Blvd
- 9840 Ramona St
- 9854 Ramona St Unit B
- 9854 Ramona St Unit A
- 9827 Cedar St
- 9827 Cedar St Unit J
- 9827 Cedar St Unit I
- 9827 Cedar St Unit H
- 9827 Cedar St Unit G
- 9827 Cedar St Unit F
- 9827 Cedar St Unit E
- 9827 Cedar St Unit D
- 9827 Cedar St Unit C
- 9827 Cedar St Unit B
- 9827 Cedar St Unit A
- 9831 Cedar St Unit 13
- 9833 Cedar St
- 9827 Cedar St Unit K