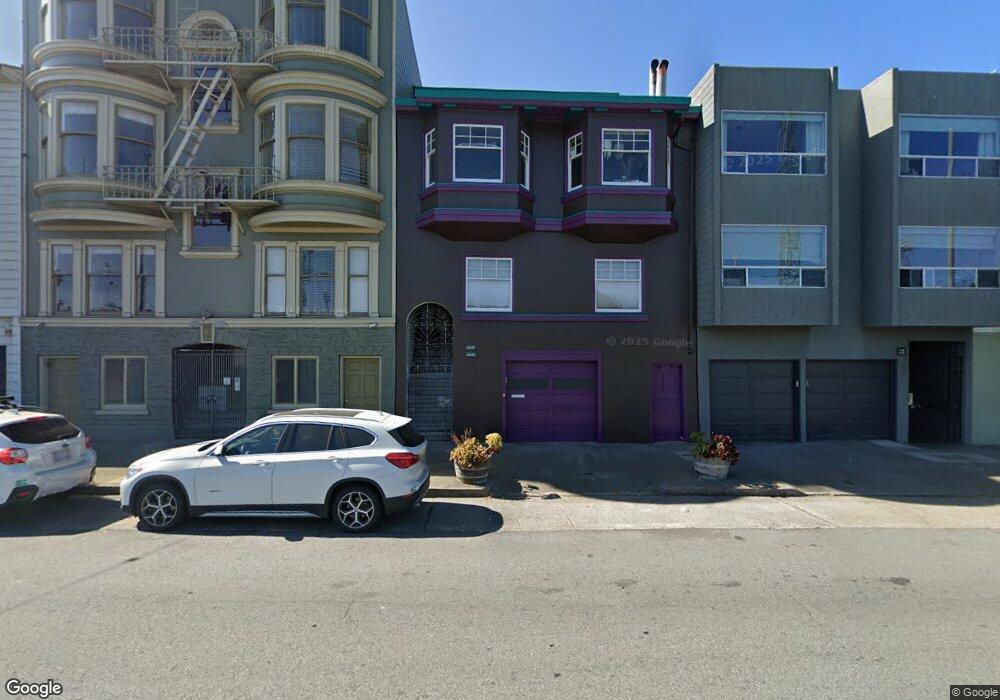
1763 Chestnut St Unit 1765 San Francisco, CA 94123
Marina District NeighborhoodEstimated Value: $1,168,986 - $3,291,000
--
Bed
3
Baths
3,260
Sq Ft
$601/Sq Ft
Est. Value
About This Home
This home is located at 1763 Chestnut St Unit 1765, San Francisco, CA 94123 and is currently estimated at $1,959,247, approximately $600 per square foot. 1763 Chestnut St Unit 1765 is a home located in San Francisco County with nearby schools including Sherman Elementary, Marina Middle School, and Mary L. Booker Leadership Academy.
Ownership History
Date
Name
Owned For
Owner Type
Purchase Details
Closed on
Feb 5, 2016
Sold by
Rodgers Derek Spencer
Bought by
Johnson Rebecca F and Rodgers Derek Spencer
Current Estimated Value
Home Financials for this Owner
Home Financials are based on the most recent Mortgage that was taken out on this home.
Original Mortgage
$1,200,000
Outstanding Balance
$924,358
Interest Rate
2.95%
Mortgage Type
Commercial
Estimated Equity
$1,034,889
Purchase Details
Closed on
Nov 23, 2015
Sold by
Giberson Vickie
Bought by
Giberson Bruce F
Purchase Details
Closed on
May 3, 2013
Sold by
Rodgers William Forsyth and Rodgers Carol Lewis
Bought by
Rodgers Derek Spencer
Purchase Details
Closed on
Sep 29, 1994
Sold by
Rodgers Carol and Rodgers Carol L
Bought by
Rodgers William Forsyth and Rodgers Carol Lewis
Create a Home Valuation Report for This Property
The Home Valuation Report is an in-depth analysis detailing your home's value as well as a comparison with similar homes in the area
Home Values in the Area
Average Home Value in this Area
Purchase History
| Date | Buyer | Sale Price | Title Company |
|---|---|---|---|
| Johnson Rebecca F | -- | Old Republic Title Company | |
| Giberson Bruce F | -- | First American Title Company | |
| Rodgers Derek Spencer | $1,380,000 | First American Title Company | |
| Rodgers Derek Spencer | -- | None Available | |
| Rodgers William Forsyth | -- | -- |
Source: Public Records
Mortgage History
| Date | Status | Borrower | Loan Amount |
|---|---|---|---|
| Open | Johnson Rebecca F | $1,200,000 |
Source: Public Records
Tax History Compared to Growth
Tax History
| Year | Tax Paid | Tax Assessment Tax Assessment Total Assessment is a certain percentage of the fair market value that is determined by local assessors to be the total taxable value of land and additions on the property. | Land | Improvement |
|---|---|---|---|---|
| 2025 | $6,046 | $439,103 | $263,471 | $175,632 |
| 2024 | $6,046 | $430,494 | $258,305 | $172,189 |
| 2023 | $5,856 | $422,054 | $253,241 | $168,813 |
| 2022 | $5,718 | $413,779 | $248,276 | $165,503 |
| 2021 | $5,615 | $405,666 | $243,408 | $162,258 |
| 2020 | $5,806 | $401,508 | $240,913 | $160,595 |
| 2019 | $5,620 | $393,637 | $236,190 | $157,447 |
| 2018 | $5,426 | $385,919 | $231,559 | $154,360 |
| 2017 | $5,066 | $378,353 | $227,019 | $151,334 |
| 2016 | $4,950 | $370,935 | $222,568 | $148,367 |
| 2015 | $4,880 | $365,293 | $219,188 | $146,105 |
| 2014 | $4,756 | $358,139 | $214,895 | $143,244 |
Source: Public Records
Map
Nearby Homes
- 115 Magnolia St
- 1864 Greenwich St
- 3110 Buchanan St
- 32 Harris Place Unit A
- 1500 Francisco St Unit 1
- 1630 Lombard St
- 1468 Francisco St Unit 1
- 2916 Gough St
- 1755 Filbert St Unit 1
- 1671 Greenwich St
- 1734 Bay St Unit 106
- 1776 Green St Unit 201
- 2100 Green St Unit 206
- 3537-3539 Fillmore St
- 1998 Vallejo St Unit 2
- 2160 Vallejo St
- 1374-1376 Chestnut St
- 1345 Chestnut St
- 3675 Fillmore St Unit 302
- 2040 Broadway St Unit 102
- 1775 Chestnut St
- 1773 Chestnut St
- 1759 Chestnut St
- 1755 Chestnut St Unit A
- 1755 Chestnut St
- 1777 Chestnut St
- 66 Magnolia St Unit 2
- 66 Magnolia St
- 1747 Chestnut St
- 76 Magnolia St
- 1745 Chestnut St
- 1737 Chestnut St
- 3344 Buchanan St
- 3338 Buchanan St Unit 3340
- 47 Magnolia St
- 1725 Chestnut St
- 37 Magnolia St
- 1850 Lombard St
- 1848 Lombard St
- 1840 Lombard St Unit 1842