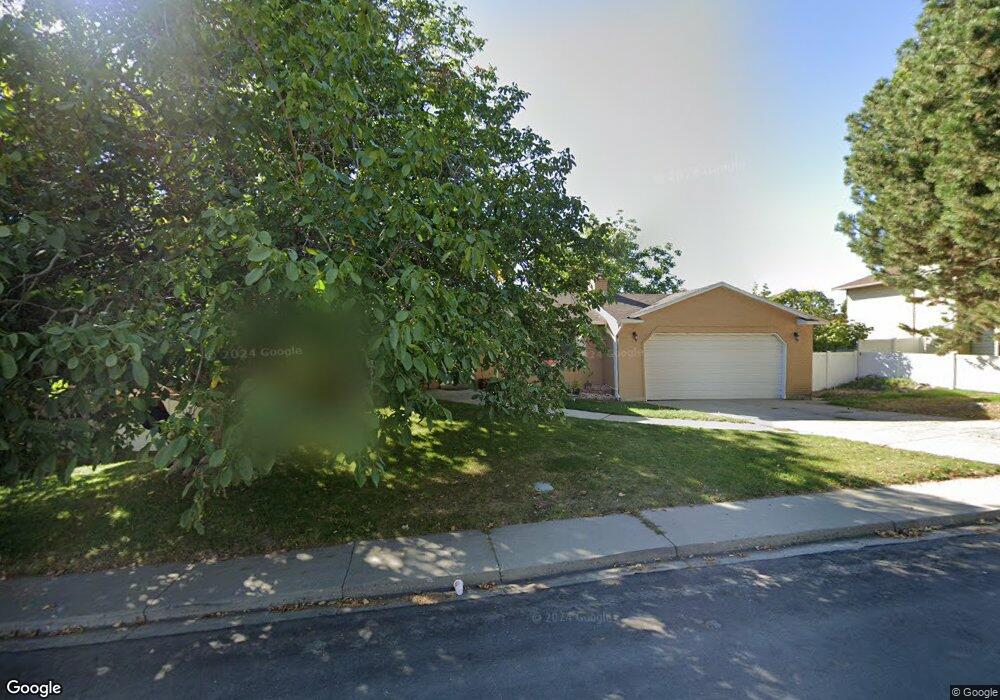
1763 Moor Ln Orem, UT 84057
Northridge NeighborhoodEstimated Value: $501,000 - $571,414
4
Beds
3
Baths
2,400
Sq Ft
$226/Sq Ft
Est. Value
About This Home
This home is located at 1763 Moor Ln, Orem, UT 84057 and is currently estimated at $543,354, approximately $226 per square foot. 1763 Moor Ln is a home located in Utah County with nearby schools including Northridge Elementary School, Oak Canyon Junior High School, and Timpanogos High School.
Ownership History
Date
Name
Owned For
Owner Type
Purchase Details
Closed on
Mar 13, 2017
Sold by
Fjerstad Roger Leon and Fjerstad Charlen Marie
Bought by
Fjestad Roger Leon and Fjestad Charlene Marie
Current Estimated Value
Purchase Details
Closed on
Nov 1, 2011
Sold by
Fjerstad Roger and Fjerstad Charlene
Bought by
Fjerstad Roger Leon and Fjerstad Charlene Marie
Purchase Details
Closed on
Jan 29, 2009
Sold by
Staheli Brian
Bought by
Moon Jonathan D and Moon Richelle E
Home Financials for this Owner
Home Financials are based on the most recent Mortgage that was taken out on this home.
Original Mortgage
$200,000
Interest Rate
5.01%
Mortgage Type
Purchase Money Mortgage
Purchase Details
Closed on
Aug 20, 2003
Sold by
Gull Joan
Bought by
Staheli Brian
Home Financials for this Owner
Home Financials are based on the most recent Mortgage that was taken out on this home.
Original Mortgage
$156,051
Interest Rate
5.46%
Mortgage Type
FHA
Create a Home Valuation Report for This Property
The Home Valuation Report is an in-depth analysis detailing your home's value as well as a comparison with similar homes in the area
Home Values in the Area
Average Home Value in this Area
Purchase History
| Date | Buyer | Sale Price | Title Company |
|---|---|---|---|
| Fjestad Roger Leon | -- | None Available | |
| Fjerstad Roger Leon | -- | None Available | |
| Fjerstad Roger Leon | -- | Accommodation | |
| Fjerstad Roger | -- | Title West Orem | |
| Moon Jonathan D | -- | Provo Land Title Co | |
| Staheli Brian | -- | Provo Land Title Company |
Source: Public Records
Mortgage History
| Date | Status | Borrower | Loan Amount |
|---|---|---|---|
| Previous Owner | Moon Jonathan D | $200,000 | |
| Previous Owner | Staheli Brian | $156,051 |
Source: Public Records
Tax History
| Year | Tax Paid | Tax Assessment Tax Assessment Total Assessment is a certain percentage of the fair market value that is determined by local assessors to be the total taxable value of land and additions on the property. | Land | Improvement |
|---|---|---|---|---|
| 2025 | $2,159 | $290,290 | -- | -- |
| 2024 | $1,991 | $264,055 | $0 | $0 |
| 2023 | $47 | $261,690 | $0 | $0 |
| 2022 | $47 | $278,410 | $0 | $0 |
| 2021 | $1,936 | $373,300 | $151,800 | $221,500 |
| 2020 | $116 | $338,600 | $121,400 | $217,200 |
| 2019 | $1,574 | $310,300 | $121,400 | $188,900 |
| 2018 | $1,535 | $289,100 | $114,500 | $174,600 |
| 2017 | $1,387 | $139,920 | $0 | $0 |
| 2016 | $1,359 | $126,390 | $0 | $0 |
| 2015 | $314 | $119,130 | $0 | $0 |
| 2014 | $1,299 | $113,795 | $0 | $0 |
Source: Public Records
Map
Nearby Homes
- 193 E 1570 N
- 363 E 1395 N Unit 22
- 1371 N 330 E Unit 8
- 87 W 1525 N
- 1643 N Mountain Oaks Dr
- 713 E 1500 St N Unit 19
- 713 E 1450 N Unit 23
- 372 E 1165 N
- 733 E 1450 N Unit 5
- 1547 N 275 West St Unit 5
- 1366 N 750 E Unit LOT 12
- 1356 N 750 E Unit 11
- 1051 E 100 N
- 1324 N 750 E Unit 3
- 332 W Amiron Way Unit D
- 1461 N Amiron Way Unit D
- 1461 N Amiron Way Unit B
- 1987 N 400 W
- 687 E 175 N
- 127 S 400 E
- 1765 Moor Ln
- 1759 Moor Ln
- 282 Gold River Cir
- 288 Gold River Cir
- 1756 Gold River Dr
- 1764 Moor Ln
- 1762 Moor Ln
- 332 Ridge Rd
- 332 Ridge Rd
- 274 Gold River Cir
- 285 Gold River Cir
- 1744 Moor Ln
- 1757 N 400 E
- 1739 Moor Ln
- 306 Ridge Rd
- 1767 N 400 E
- 1733 N 400 E
- 1753 Gold River Dr
- 279 Gold River Cir
- 1757 Gold River Dr
Your Personal Tour Guide
Ask me questions while you tour the home.