Estimated Value: $443,000 - $462,442
5
Beds
3
Baths
2,784
Sq Ft
$163/Sq Ft
Est. Value
About This Home
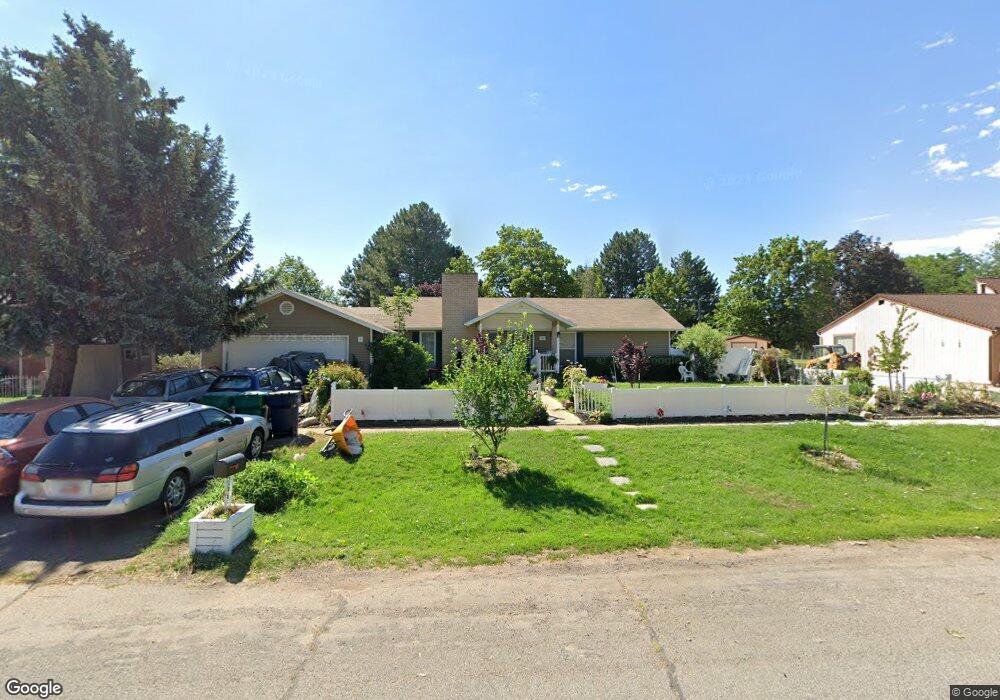
This home is located at 1763 W 4500 S, Roy, UT 84067 and is currently estimated at $454,861, approximately $163 per square foot. 1763 W 4500 S is a home located in Weber County with nearby schools including Valley View School, Sand Ridge Junior High School, and Roy High School.
Ownership History
Date
Name
Owned For
Owner Type
Purchase Details
Closed on
Nov 18, 2021
Sold by
Wright Johnathan Wayne and Wright Austin Johnathan
Bought by
Wright Johnathan W
Current Estimated Value
Purchase Details
Closed on
Feb 15, 2018
Sold by
Lyman Dilworth Nielson and Lyman Paul Douglas
Bought by
Wright Johnathan Wayne and Wright Austin Johnathan
Purchase Details
Closed on
Oct 27, 2010
Sold by
Lyman Dilworth and Lyman Dilworth Nielson
Bought by
Lyman Dilworth Nielson and Lyman Paul Douglas
Create a Home Valuation Report for This Property
The Home Valuation Report is an in-depth analysis detailing your home's value as well as a comparison with similar homes in the area
Home Values in the Area
Average Home Value in this Area
Purchase History
| Date | Buyer | Sale Price | Title Company |
|---|---|---|---|
| Wright Johnathan W | -- | None Listed On Document | |
| Wright Johnathan Wayne | -- | Founders Title Cpo | |
| Lyman Dilworth Nielson | -- | None Available |
Source: Public Records
Tax History
| Year | Tax Paid | Tax Assessment Tax Assessment Total Assessment is a certain percentage of the fair market value that is determined by local assessors to be the total taxable value of land and additions on the property. | Land | Improvement |
|---|---|---|---|---|
| 2025 | $2,881 | $461,526 | $152,344 | $309,182 |
| 2024 | $2,814 | $454,000 | $152,359 | $301,641 |
| 2023 | $2,723 | $440,000 | $147,805 | $292,195 |
| 2022 | $2,550 | $231,550 | $65,127 | $166,423 |
| 2021 | $2,222 | $333,000 | $83,835 | $249,165 |
| 2020 | $2,046 | $281,000 | $83,835 | $197,165 |
| 2019 | $2,030 | $263,000 | $48,995 | $214,005 |
| 2018 | $1,907 | $232,000 | $44,106 | $187,894 |
| 2017 | $1,776 | $202,000 | $44,106 | $157,894 |
| 2016 | $1,673 | $101,949 | $24,317 | $77,632 |
| 2015 | $1,562 | $97,459 | $21,628 | $75,831 |
| 2014 | $1,507 | $92,601 | $21,628 | $70,973 |
Source: Public Records
Map
Nearby Homes
- 4539 S 1800 W Unit 127
- 4536 S 1900 W Unit 12
- 4593 Promenade Dr Unit 16
- 4602 Hathaway Dr
- 4642 S 1900 W Unit 41
- 2038 W 4600 S
- 4533 S 2075 W
- 2015 W 4225 S
- 1783 W 5000 S
- 1789 W 5000 S
- 5006 S 1800 W
- 1765 W 5000 S
- 1838 W 5050 S
- 4220 S 2075 W
- 1829 W 5050 S
- 4328 S 2175 W
- 4851 S 2075 W
- 2153 W 4800 S
- 1779 W 5125 S
- 1959 3985 St S Unit 2